Description of the study population
The population studied consisted of patients from the Pujini and Dodo shehias on Pemba Island, Tanzania; the Kisoro and Kabale districts in Uganda; the Dabou and Jacqueville regions around the Lagunes district in Côte d’Ivoire; and the Nambak district and Luang Prabang province in Laos (Fig. 1, adapted from Keller et al.20). This study included frozen faecal samples from participants aged 6 to 60 years in Côte d’Ivoire, Tanzania, and Laos, as well as ethanol-preserved faecal samples from school-aged children (6–12 years) in Uganda.

The map of the world highlights the four study locations, each represented by a distinct colour: orange for Côte d’Ivoire, green for Tanzania, yellow for Uganda, and blue for Laos.
Stool samples used in this study were collected in the framework of a double-blind, placebo-controlled randomized trial conducted between September 2018 and June 2020 in Côte d’Ivoire, Tanzania, and Laos18,21,22 as well as a parallel open-label randomized controlled superiority trial conducted between October to November 2023 in Uganda19 Demographics and helminth infection characteristics of the participants included in this study are summarized in Table 1 and Supplementary Data 1 and 219.
Of the 687 participants, 54.3% (370/682) were female and 45.7% (312/682) were male across the four countries. Overall, the Laos participants were older (mean age 23.9 years [SD 16.7]) than the other three cohorts (mean age 17.3 years [SD 14.2] in Côte d’Ivoire, 13.9 years [SD 10.0] in Tanzania, and 9.4 years [SD 2.1] in Uganda). The infection intensities as diagnosed with Kato-Katz and sex distribution of the study participants depict a good balance between groups. Of note, at the start of the PCR-based investigation, we also included five additional samples lacking metadata apart from country of origin (2 from Côte d’Ivoire, 2 from Tanzania, and 1 from Laos), hence the total number of participants analyzed for the ITS2 region to 687.
Molecular analysis of ITS2 nuclear marker
Following DNA extraction, we successfully produced amplicons from 186, 188, 135, and 173 participants in Côte d’Ivoire, Tanzania and Uganda, and Laos, respectively. Using a Promethion sequencing platform, we generated a total of 30,794,777 (322–812,627 unprocessed reads per sample). Using a stringent DADA2-based pipeline (Supplementary Fig. 1), we retained a total of 23,445,373 reads (109–585,322 high-quality reads per sample, Supplementary Fig. 2a–c). Samples with more than 500 high-quality, post-DADA2 reads (657/687, 95.6%) were retained. The DADA2 error plots are shown in Supplementary Fig. 3. Using this dataset, a total of 2828 ASVs were generated, which were further clustered into 215 unique ASV clusters with consensus sequences using a 98.5% identity threshold. This 98.5% threshold was defined based on ASV variation observed in our positive controls, which consisted of single-worm heads from T. trichiura and T. incognita. 8/215 consensus sequences were further removed as they formed singleton clusters and the remaining 207 ASV clusters (Supplementary Data 3) were then used for population genetics and phylogenetic inferences.
Haplotype network analysis
For the population network analysis, the 207 ASVs were grouped into 170 haplotypes using default thresholds in DnaSP (Supplementary Data 4). Overall, 48/170 haplotypes were found in two or more countries, while 122 haplotypes were found in one setting only (66, 17, 25, and 14 haplotypes unique to Côte d’Ivoire, Tanzania, Uganda, and Laos, respectively). Prevalence of all the haplotypes is shown in Supplementary Data 4. Several haplotypes were present in a substantial number of samples, following country-specific patterns. For instance, Hap 1 was found in 7.0% of the samples from Laos and Tanzania, but 4.0% in the other settings. Hap 37 was the dominant haplotype in Laos (13%) but was only present in 1.0%-9.0% of samples in the other countries. The BLAST results of all haplotypes are summarized in Supplementary Data 5.
The statistical parsimony haplotype network analysis revealed a clear structure separating all the Trichuris haplotypes into two main clusters (Fig. 2), suggesting the existence of at least two divergent evolutionary lineages circulating across these populations. An overrepresentation of haplotypes from Côte d’Ivoire was found to cluster together with our T. incognita single worm controls (N = 4), with the most abundant haplotype being Hap 1 (5.4%). The second cluster, which contained T. trichiura single worm controls, was structured around Hap 37, Hap 38, and Hap 39. The significant difference between both clusters is highlighted by the number of nucleotide differences between the two least dissimilar sequences from both clusters (113 SNPs), thus representing a large portion of the expected amplicon sizes for both species (between ~520 and 600 bp). Interestingly, we also observed that one haplotype, Hap 155, showed a significant amount of differences (N = 42) with its closest related sequence from the T. incognita cluster, thus suggesting further stratification of the haplotype population. Overall, the haplotype network suggests that T. trichiura-like haplotypes are diversified into distinct subpopulations, while T. incognita-like haplotypes are more homogeneous and might result from more recently diverged populations.

Haplotype network inferred from ASVs of Trichuris species haplotype sequences from Côte d’Ivoire, Laos, Tanzania, and Uganda. N = pairwise number of nucleotide differences between the main clusters; each hatch mark along the network branches corresponds to a nucleotide difference. Each circle represents a unique haplotype, and the circle’s size is proportional to the corresponding haplotype frequency. The colours of the pie charts represent the country of origin (Red for Côte d’Ivoire; light green for Laos; yellow for Tanzania; dark green for Uganda). Star symbols denote Trichuris incognita and Trichuris trichiura reference control sequences: obtained from individual worms.
Phylogenetic placement of sequence variants in the context of publicly available ITS2 sequences
The phylogenetic analysis was conducted using the 207 consensus sequences from ASV clusters generated in this study and a total of 97 ITS2 fragments obtained from GenBank. Firstly, to annotate each of our consensus sequences with a species label, we performed a clustering of all consensus sequences using a 90% threshold, which resulted in three main clusters, each containing the sequences extracted from the whole genome sequences of T. trichiura, T. incognita, and T. suis. Each consensus sequence was subsequently annotated with one of the 3 species, depending on which cluster they grouped in. To improve the clarity of the phylogenetic tree, we extracted the two most abundant consensus sequences corresponding to T. trichiura and T. incognita for samples with mixed infections, or the most abundant sequence in the case of a monoinfection, and used these sequences (N = 1146 sequences) — along the public ITS2 references (N = 97) to generate the corresponding phylogenetic tree (Fig. 3).

Maximum likelihood tree based on the ITS2 rDNA using Tamura-Nei with gamma distribution as the substitution model and Trichinella spiralis (GenBank accession: KC006432) as an outgroup. Colored branches correspond to major clades A to E, which broadly align with WGS-derived sequences from T. trichiura, T. incognita, T. suis, T. muris, and livestock-derived reference sequences. The external rings (from inner to outer) are colored according to metadata, including host type, country of origin, and whether the sequences were generated in this study or obtained from a public database. The host silhouettes (human, livestock, rodent, non-human primates) supporting the phylogenetic tree were created in BioRender. Pierre, S. (2025) https://BioRender.com/6cv1f89.
We identified five clades, each corresponding to different but taxonomically related host species and broadly matching with published whole genome sequences (WGS) of Trichuris species. Clade A consisted of published ITS2 sequences of Trichuris species of Indian bison, camel, deer, and sheep, and was the only clade which did not contain any well-characterized WGS of a specific Trichuris species. Clade B consisted of published sequences of Trichuris species of arvicolids and murid rodents, and included the sequence of an ITS2 region from a previously published WGS of T. muris. Clade C consisted of published sequences of Trichuris species of pigs, which correctly matched the WGS of T. suis23. Interestingly, one of the sequences generated in this study, which was found in 3 samples from Uganda, clustered together with the WGS of T. suis23, along with other T. suis sequences from China, Denmark, and the USA. Clade D contains ITS2 sequences found in 44.8% of sequences identified in this study (N = 510 sequences, with mono- or mixed infections), as well as 14 publicly available sequences of human and NHP species clustering with the WGS sequence of the recently identified T. incognita10. This clade also contained the sequences from the single worm positive controls from Côte d’Ivoire, which we included in this study, as well as other published partial sequences from humans in Cameroon, NHP from Italy, Uganda, South Africa. 626 sequences from our study clustered together with 36 ITS2 reference sequences of human and NHP species, four single worm controls from T. trichiura, and one WGS-derived sequence from the human type-species, T. trichiura, into clade E. Clade E also contained published sequences from humans in Ecuador and Uganda, as well as sequences from captive and non-captive NHP from Uganda, China, South Africa, Italy, Spain, and St. Kitts & Nevis.
Analysis of genetic diversity indices across T. trichiura and T. incognita populations in the four countries revealed considerable variation between species and sampling locations (Table 2).
Nucleotide diversity (π) varied notably across populations, with T. incognita from Laos (π = 0.027) and Uganda (π = 0.020) displaying the highest values, suggesting well-established populations with divergent haplotypes. In contrast, T. trichiura from Tanzania (π = 0.011) and Laos (π = 0.012) showed relatively low nucleotide diversity, indicative of recent population expansions or limited long-term genetic divergence. The T. trichiura population from Côte d’Ivoire demonstrated high diversity (π = 0.021) combined with a large number of ASV clusters (84), reflecting possible lineage mixing or stable long-term persistence. Interestingly, T. incognita in Laos exhibited fewer ASV clusters (12) but comparatively high nucleotide diversity, highlighting the presence of distinct and divergent haplotypes. Neutrality tests showed significantly negative Tajima’s D, Fu and Li’s D, and F values for T. incognita in Côte d’Ivoire, Laos, and Tanzania (p T. trichiura also showed similar patterns, except in Tanzania (p > 0.05).
Pairwise population comparisons based on FST and exact tests of sample differentiation revealed a marked contrast between species (Fig. 4a, b). For T. incognita, some comparisons yielded low or negative FST values (e.g., LA vs TA: –0.0340; UG vs LA: –0.0053), indicating little to no population differentiation. However, modestly elevated values were observed in comparisons involving Côte d’Ivoire, specifically CI vs TA (FST = 0.0330, p T. trichiura showed consistently low FST values (range: −0.0083 to −0.0040), all of which were statistically non-significant (p > 0.05), consistent with high gene flow across populations. These results suggest that T. trichiura populations remain relatively undifferentiated across countries, while T. incognita may exhibit more structured diversity, potentially reflecting recent expansion or geographic barriers to gene flow.
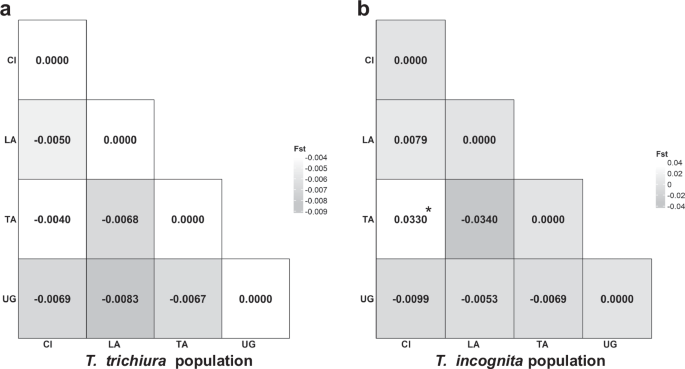
a Visual representation of the matrix of pairwise FST comparisons among Trichuris trichiura populations across countries, indicating genetic differentiation. b Visual representation of the matrix of pairwise FST comparisons among Trichuris incognita populations across countries, indicating genetic differentiation; (*p = 0.038). CI Côte d’Ivoire, LA Laos; TA Tanzania, UG Uganda; Statistical significance was assessed via two-sided permutation tests with 1000 permutations, and no adjustment for multiple comparisons was performed.
Comparative sequence analysis
We then conducted a comparative analysis across the clades and subclades previously defined for Trichuris spp. from humans, NHPs, rodents, livestock, and swine to assess intraspecific and interspecific similarities between T. trichiura, T. incognita, and T. suis (Fig. 5a).

a Pairwise comparison of sequence similarity between human samples (x-axis) from the four countries and reference sequences (y-axis). The reference sequences were clustered based on pairwise nucleotide identity values using the Ward clustering method. Sequences generated in this study were clustered separately by country using the same method. b Prevalence of mono- and mixed infections comprising human-infecting Trichuris trichiura and Trichuris incognita, stratified by country.
By examining the pairwise genetic distance obtained across the four countries, it revealed a high similarity between the population of Trichuris across different clades. Investigation of the ASVs in the Clade D showed approximately 98%–100 % nucleotide sequence identity with the WGS-derived ITS2 sequence of T. incognita, observed in Côte d’Ivoire, as well as other published partial sequences from humans in Cameroon (accession number GQ301555), NHP from Italy and Uganda, and more distantly with Chacma baboons in South Africa (accession number GQ301554) with 90% to 94% nucleotide sequence identity. Within Clade E (T. trichiura lineage), we found a high similarity with populations of T. trichiura parasitizing humans from different geographical origins, as well as NHP with 96–100% nucleotide sequence identity. Furthermore, the T. trichiura clade was also more distant from clades C (T. suis) and D (T. incognita), with nucleotide identity values ranging from 64 to 69%. The single sequence from this study, found to cluster together with T. suis in clade C shared nucleotide identities ranging from 97 to 99% identity with T. suis references, but only 82–88% identity and 70–72% identity with the T. incognita (clade D) and T. trichiura (clade E) clades, respectively. Analysis of the prevalence of human-infecting Trichuris species across the four countries revealed a high proportion of mixed infections, which accounted for the majority of cases in all settings, albeit with varying proportions (Fig. 5b). Mixed infections accounted for 80.8% of cases in Côte d’Ivoire, 86.1% in Uganda, 63.4% in Tanzania, and 62.2% in Laos. Overall, T. incognita monoinfections were observed only in Côte d’Ivoire (16.4%) and Uganda (0.8%). T. trichiura monoinfections were detected in all countries, with the lowest prevalence in Côte d’Ivoire (0.5%), followed by Uganda (13.0%), Laos (36.6%), and the highest in Tanzania (37.8%). Based on sequence prevalence, we also generated relative abundance plots for samples with mixed infections, which followed a similar pattern to the overall prevalence: T. incognita relative abundance was highest in Côte d’Ivoire, followed by Uganda, and was lowest in Tanzania and Laos (Supplementary Fig. 4).
Fragment length as a robust diagnostic marker to differentiate human-infecting Trichuris species
The fragment lengths – in basepair (bp) -of the ITS2 regions corresponding to the clade structure (clades A to E) are summarized in Fig. 6a. The length of the ITS2 regions ranged from 424.9 ± 47.6 bp for T. muris-related sequences, 443.7 ± 7.9 bp for Trichuris species found in livestock, 579.9 ± 2.1 bp for T. suis-related sequences, 595.9 ± 1.5 bp for T. incognita-related sequences, and 530.5 ± 2.9 bp for T. trichiura-related sequences. We observed significant differences in fragment length between all clades, except between T. muris and the livestock-related clade A. We next evaluated the predictive power of the ITS2 region length for distinguishing between the two human-infecting species, T. incognita and T. trichiura. To this end, we applied a random forest classification model to our dataset, as illustrated in Fig. 6b. As expected – given the complete lack of overlap in ITS2 fragment lengths between the two species – the model achieved perfect classification performance, with an area under the receiver operating characteristic curve (AUC) of 1.0, an accuracy of 100%, and a Cohen’s Kappa value of 1.0. The corresponding confusion matrix (Fig. 6c) confirms a balanced distribution of data points across classes. Collectively, these findings demonstrate that ITS2 fragment length is a highly effective and reliable diagnostic marker for differentiating between T. trichiura and T. incognita.

a Comparison of the fragment length between the five clades; Clade A (n = 9), Clade B (n = 31), Clade C (n = 17), Clade D (n = 532), and Clade E (n = 653) was conducted using pairwise two-sided Mann–Whitney tests with Benjamini–Hochberg adjustment for multiple comparisons. Boxplots show the median (centre line), interquartile range (box bounds = 25th and 75th percentiles), and whiskers indicating the 95% CI. b ROC curve showing the performance of a random forest model built using ITS2 fragment length, evaluated with a leave-one-out cross-validation (LOOCV) approach. c Confusion matrix showing the class distribution of ITS2 fragment lengths from each Trichuris species. bp: base pair.
Human-infecting Trichuris species and metadata associations
To explore potential associations between infection type and host characteristics, we focused on a subset of study participants aged 6–18 years (Supplementary Data 6). We investigated whether infections with T. incognita and T. trichiura were associated with differences in demographic or clinical metadata. Among infected individuals, females had a higher proportion of mixed infections in Tanzania (60.4%) and Uganda (55.5%). However, overall, there were no significant differences in the distribution of infection type (mixed vs. monoinfections with T. incognita or T. trichiura) by sex or country. Likewise, no significant differences were observed in infection intensity or egg counts between groups, suggesting that-within this age group-basic clinical and demographic parameters did not differ meaningfully between species (Fig. 7c).

a Stacked bar plots showing the proportion of infected individuals by sex, with percentages indicating the proportion of male (turquoise) and female (red) participants within each infection type and country. b Stacked bar plots showing the infection intensity distribution based on WHO criteria, with percentages representing the proportion of light (green), moderate (orange), and heavy (blue) infections among infected individuals in each category. c Boxplots of log-transformed Trichuris egg counts per gram (EPG) of stool (right) for each infection type across countries, with the box representing the interquartile range, contains a median line and whiskers indicating the 95% CI. Statistical comparisons between different infection types and countries were conducted using a Kruskal–Wallis test followed by adjustment with pairwise Wilcoxon rank sum exact tests for multiple comparisons (two-sided). Each dot represents an individual.


