Study characteristics
A total of 61,151 records were identified, resulting in the final inclusion of 224 articles (Fig. 1, eReferences 1–224 in Supplement 1), which encompass 8,762,901 COVID-19 patients. Detailed results regarding study characteristics (Table S1) and quality evaluation (Table S2) are presented in eResults in Supplement 1.
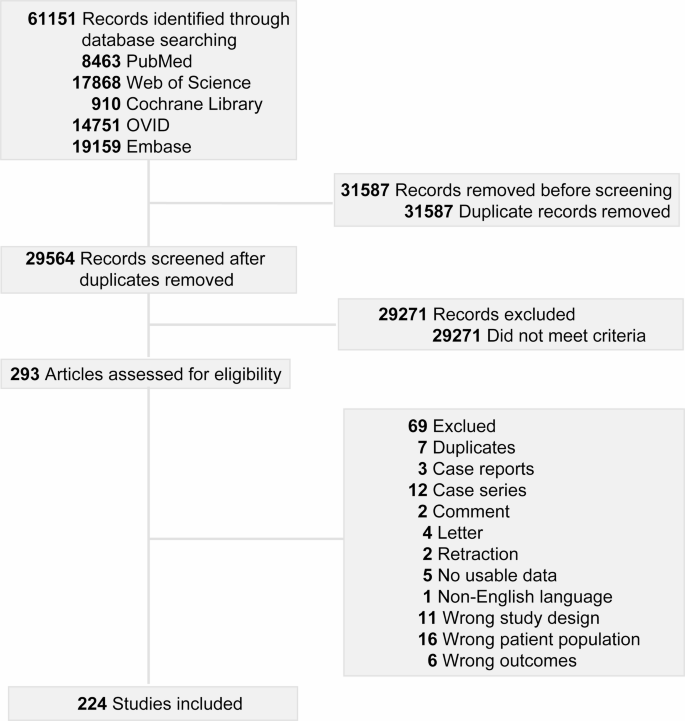
Flowchart of the Systematic Search and Selection Process. A total of 61,151 articles were retrieved, and the titles and abstracts of 29,564 articles were reviewed, as well as the full text of 293 articles. This process resulted in the inclusion of 224 studies.
VTE
In this meta-analysis, a random-effects model was constructed to ascertain the weighted pooled occurrence of VTE, which was found to be 5.8% (95% CI, 5.0%−6.7%, I2 = 99.912%; 91 studies; 4,545,285 patients; Figure S1). This finding indicates that COVID-19 patients are at an elevated risk for VTE. Both the funnel plot and the Egger test (p = 0.004) suggested that the study results were subject to publication bias (Figure S2). However, we confirmed the stability of the study results through the trim-and-fill method, indicating that publication bias did not significantly affect the overall estimates. VTE encompassed DVT (4.8%, 95% CI, 4.2%−5.3%, I2 = 99.750%; 118 studies; 3,591,730 patients; Figure S3) and PE (7.2%, 95% CI, 6.4%−7.9%, I2 = 99.808%; 161 studies; 3,442,823 patients; Figure S4). Other results of the funnel plot and Egger tests are illustrated in Figure S5-S9. In instances where research findings indicated publication bias, the trim-and-fill method was employed to rectify the results, thereby facilitating an assessment of the research data’s reliability (Table S3).
Subgroup analysis of inpatients
The majority of the population were inpatients, and the findings related to the occurrence of thromboembolism were similar to those observed in the overall COVID-19 cohort. The occurrence of VTE was 6.1% (95% CI, 5.7%−6.6%, I2 = 98.324%; 79 studies; 1,313,226 patients; Figure S10), including DVT (5.3%, 95% CI, 4.8%−5.8%, I2 = 98.646%; 102 studies; 1,001,457 patients; Figure S11) and PE (7.1%, 95% CI, 6.5%−7.7%, I2 = 98.622%; 131 studies; 1,018,974 patients; Figure S12).
Subgroup analysis of ICU vs. Ward patients
The occurrence of VTE varies significantly based on the disease status and type of patient hospitalized. Inpatients with COVID-19 can be categorized into two distinct groups based on their disease status: ICU patients and ward patients. A significantly higher occurrence of VTE was observed in the ICU compared to the ward (13.2%, 95% CI, 11.7%−14.7%; I² = 96.840%; 47 studies; 172,571 patients, vs. 3.2%, 95% CI, 2.9%−3.5%; I² = 95.714%; 40 studies; 1,046,738 patients; P < 0.001; Fig. 2). This finding indicates that ICU patients may be at an increased risk of thrombosis. A consistent conclusion can be drawn regarding DVT (9.8%, 95% CI, 8.5%−11.3%; I2 = 97.694%; 46 studies; 170,445 patients, vs. 3.6%, 95% CI, 3.0%−4.3%; I2 = 98.652%; 36 studies; 729,556 patients; P < 0.001; Figure S13) and PE (11.6%, 95% CI, 10.3%−13.0%; I2 = 97.595%; 63 studies; 185,633 patients, vs. 5.1%, 95% CI, 4.4%−5.8%; I2 = 98.664%; 50 studies; 738,299 patients; P < 0.001; Figure S14).
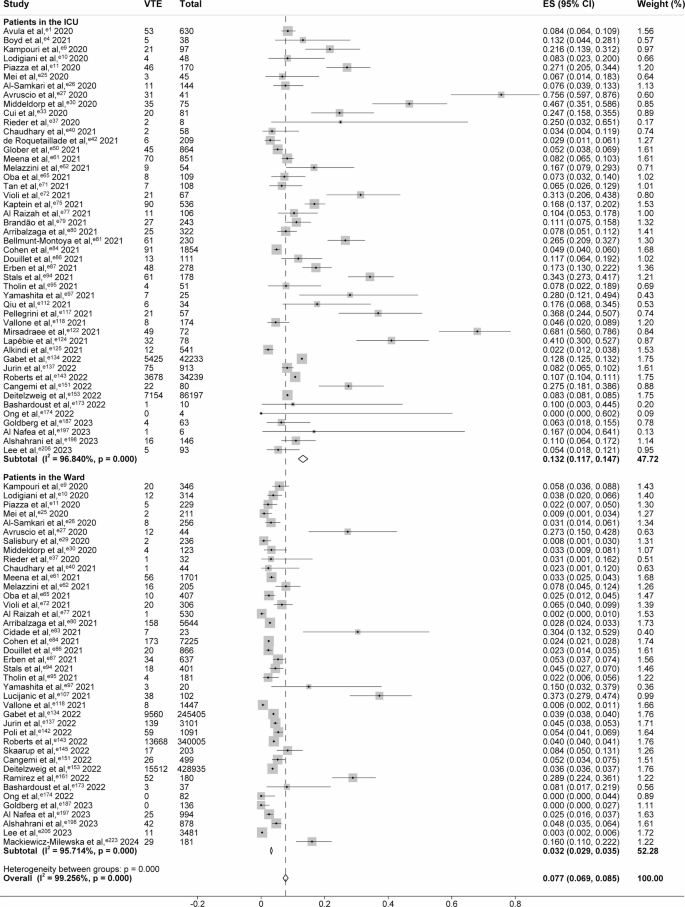
Forest Plot Showing the Occurrence of VTE among Patients in the ICU vs. the Ward. The “VTE” column indicates the number of cases of venous thromboembolism among COVID-19 patients. The “Total” column indicates the total number of COVID-19 patients. Squares are used to indicate the occurrence of VTE, with horizontal lines denoting 95% CI. The size of the squares corresponds to the weight of the data point. Diamonds are used to represent pooled estimates, with the outer points of the diamonds indicating the 95% CI.
Subgroup analysis of outpatients vs. discharged patients
The occurrence of VTE was observed to be significantly lower among non-hospitalized patients when compared to the inpatient population. Patients exhibiting mild symptoms of COVID-19 do not require hospitalization or have been discharged. In this non-hospitalized subgroup, the occurrence of VTE was found to be low; this was particularly evident among outpatients, who demonstrated a nearly indiscernible risk of VTE (0.0%, 95% CI, 0.0%−0.0%; I² = 99.410%; 10 studies; 2,566,194 patients, vs. 0.7%, 95% CI, 0.4%−1.1%; I² = 98.924%; 16 studies; 828,884 patients; P < 0.001; Figure S15). A similar low occurrence of DVT was also observed in outpatient and discharged patients. At the same time, no substantial differences were present (0.0%, 95% CI, 0.0%−0.0%; I² = 99.209%; 10 studies; 1,900,632 patients, vs. 0.3%, 95% CI, 0.1%−0.7%; I² = 98.345%; 11 studies; 601,817 patients; P = 0.159; Figure S16). However, the occurrence of PE was higher in outpatients than in discharged patients (1.0%, 95% CI, 0.6%−1.6%; I² = 99.378%; 18 studies; 1,901,326 patients, vs. 0.6%, 95% CI, 0.3%−0.9%; I² = 82.849%; 15 studies; 53,085 patients; P < 0.001; Figure S17).
ATE
A subsequent analysis of ATE in COVID-19 patients was also conducted. The findings of the study indicated that the pooled occurrence of ATE was 2.6% (95% CI, 1.8%−3.5%, I²=99.924%; 44 studies; 2,884,839 patients; Figure S18), including MI (1.7%, 95% CI, 1.2%−2.4%, I2 = 99.949%; 57 studies; 5,989,089 patients; Figure S19) and stroke (1.2%, 95% CI, 1.0%−1.4%, I2 = 99.589%; 83 studies; 3,806,912 patients; Figure S20).
Subgroup analysis of inpatients
Similarly, the occurrence of ATE in inpatients was found to be analogous to that observed in the overall population. The occurrence of ATE was 3.2% (95% CI, 2.1%−4.5%; I² = 99.545%; 38 studies; 618,234 patients; Figure S21), which included MI (2.0%, 95% CI, 1.7%−2.3%; I² = 99.134%; 43 studies; 3,255,056 patients; Figure S22) and stroke (1.3%, 95% CI, 1.0%−1.6%; I² = 98.298%; 62 studies; 786,368 patients; Figure S23).
Subgroup analysis of ICU vs. ward patients
A comparative analysis of the occurrence of ATE revealed a significantly higher occurrence in the ICU than in the ward (7.3%, 95% CI, 5.1%−9.9%; I2 = 93.156%; 21 studies; 89,934 patients, vs. 2.0%, 95% CI, 1.0%−3.3%; I2 = 96.903%; 15 studies; 439,099 patients; P < 0.001; Figure S24). Moreover, a comparison of MI (3.0%, 95% CI, 2.0%−4.2%; I2 = 98.620%; 22 studies; 144,853 patients, vs. 1.0%, 95% CI, 0.4%−1.8%; I2 = 99.485%; 15 studies; 532,014 patients; P = 0.001; Figure S25) and stroke (2.4%, 95% CI, 1.8%−3.1%; I2 = 97.286%; 31 studies; 157,713 patients, vs. 0.8%, 95% CI, 0.5%−1.3%; I2 = 99.128%; 22 studies; 558,317 patients; P < 0.001; Figure S26) between the two groups also demonstrated a high prevalence of thrombosis in the ICU cohort.
Subgroup analysis of outpatients vs. discharged patients
There is no significant difference found in the occurrence of ATE between outpatients and discharged patients (0.3%, 95% CI, 0.1%−0.4%; I² = 98.918%; 4 studies; 2,126,500 patients, vs. 0.6%, 95% CI, 0.1%−1.4%; I² = 91.856%; 6 studies; 10,566 patients; P = 0.142; Figure S27). However, a lower prevalence of MI was observed among outpatients. (0.2%, 95% CI, 0.1%−0.4%; I² = 98.983%; 3 studies; 1,390,366 patients, vs. 0.7%, 95% CI, 0.5%−0.9%; I² = 97.185%; 12 studies; 1,123,585 patients; P < 0.001; Fig. 3). Additionally, no substantial discrepancy was observed between the two groups with respect to the occurrence of stroke (0.3%, 95% CI, 0.1%−0.7%; I² = 99.767%; 8 studies; 1,658,089 patients, vs. 0.6%, 95% CI, 0.3%−1.0%; I² = 99.561%; 13 studies; 1,123,748 patients; P = 0.263; Figure S28).

Forest Plot Showing the Occurrence of MI among Outpatients vs. Discharged Patients. The “MI” column indicates the number of cases of myocardial infarction among COVID-19 patients. The “Total” column indicates the total number of COVID-19 patients. Squares are used to indicate the occurrence of MI, with horizontal lines denoting 95% CI. The size of the squares corresponds to the weight of the data point. Diamonds are used to represent pooled estimates, with the outer points of the diamonds indicating the 95% CI.
Meta-regression analysis and other subgroup analysis
A meta-regression analysis was conducted to investigate the potential contribution of various continuous variables to the observed heterogeneity, as well as their association with the outcomes (Table 1, S4-S8). The occurrence of VTE was found to be significantly higher in the patients with a greater mean age (p = 0.011, Figure S29). Moreover, the incidence of both VTE and PE was found to be notably reduced in the female population (p < 0.05, Figures S30-S31). In relation to the variable proportion of patients receiving prophylactic anticoagulation, a significant and positive correlation was identified with all indicators, with the exception of MI (p < 0.05, Figs. 4, S32-S35). Additional detailed results from the meta-regression analysis (Figures S36-S44) and other subgroup analysis (Tables S9-S18) can be found in eResults in Supplement 1.

Meta-regression Analysis Exploring the Relationship between Proportion of Patients with Prophylactic Anticoagulation and ATE Occurrence. Circles indicate studies included in meta-regression. The size of the circles corresponds to the sample size. The red solid curve represents the prediction of ATE occurrence. ATE, arterial thromboembolism.


