Xpert ultra assay result and amplified probes for NTM isolates
All the tested 87 NTM isolates had a valid Xpert Ultra assay result, which was MTB Not Detected (negative). There was at least one probe amplification in 88.5% (77) of the NTM isolates. Two or more probe amplifications were observed in 16.1%14 of them. The most frequently amplified probe was rpoB2 (77, 88.5%), followed by rpoB4 (10, 11.5%), rpoB1 (6, 6.9%), and rpoB3 (1, 1.1%). Amplification was not observed for IS1081/IS6110. The combination of amplified probes was rpoB2 and rpoB4 in 10 isolates (11.5%), and rpoB1 and rpoB2 in six (6.9%) isolates. In one NTM isolate (1.1%), three probes; rpoB1, rpoB2, and rpoB4, were amplified together, and in one isolate (1.1%), four probes; rpoB1, rpoB2,rpoB3, and rpoB4, were amplified together (Table 1). All 87 NTM species were detected in the culture of clinical specimens with negative Xpert Ultra assay results, and 11 (12.6%) of the NTM isolates had probe amplification in the Xpert Ultra assay conducted from their corresponding direct specimen. Among the 87 NTM isolates tested using the Xpert MTB/RIF assay, all had a negative result. In this assay, probe amplification to at least one probe was observed for 78.2% (68) isolates, and 69.9% (60), 8.0%7, and 1.1%1 of the isolates had one, two, and three probe amplification, respectively. The most frequently amplified probe was Probe C (64, 73.6%), followed by Probe A (7, 8.0%) and Probe E (6, 6.9%) (Table 1).
The amplified probe types per the NTM species
The tested NTM isolates per species based on the Genotype CM/AS assay were: M. fortuitum (45), M. simiae8, M. gordonae7, M. avium complex6, M. scrofulaceum1, M. celatum1, M. ulcerans1, M. asiaticum1, and unidentified Mycobacterium species17. All the M. simiae (8,100%) M. gordonae (7,100%) M. scrofulaceum (1,100%) M. celatum (1,100%) M. asiaticum (1,100%), and M. ulcerans (1,100%) isolates had at least one probe amplification. Whereas, probe amplification was detected in 41 of 45 (91.1%) M. fortuitum isolates, 13 of 17 (76.5%) unidentified Mycobacterium species, and four of six (66.7%) M. avium complex isolates (Table 2).
Specific to the amplified probe type per NTM species, all isolates of M. simiae (8,100%), M. celatum (1,100%), and M. ulcerans (1,100%) had probe amplification at the rpoB2 region. Whereas, among M. gordonae isolates, six (85.7%) had amplification at both rpoB2 and rpoB4 probes, with one of these isolates having additional amplification for rpoB1. One M. gordonae isolate had amplification at the rpoB2 probe only. Among the four M. avium complex isolates with amplified probes, one had amplification at rpoB2 and three had amplification for two probes (rpoB1 and rpoB2). For the M. scrofulaceum isolate, both rpoB1 and rpoB2 were amplified. All the M. fortuitum (41) isolates had rpoB2 probe amplification, and one among the isolates had additional rpoB4 amplification. All 13 unidentified Mycobacterium species with probe amplification had rpoB2 probe amplification, with additional rpoB4 probe amplification for two isolates. The M. asiaticum isolate had amplification for the four probes (rpoB1, rpoB2, rpoB3, and rpoB4). (Fig. 1). When assessed individually, there was no statistically significant association between the NTM species and the presence of one or more rpoB probe amplification (Table 2).

The number and type of probe amplifications observed per NTM species. The types of amplified probes are presented per the specific NTM species.
In the Xpert MTB/RIF assay, Probe A was amplified among 83.3%5, 2.2%1, and 100%1 of M. avium complex, M. fortuitum group, and M. scrofulaceum species, respectively. Probe C was observed in all NTM types, with 100% amplification for M. scrofulaceum, M. asiaticum, M. celatum, M. simiae, and M. ulcerans. It was amplified in 77.8% (35), 57.1%4, and 70.6%12 of M. fortuitum group, M. gordonae, and unidentified Mycobacterium species, respectively. Amplification to Probe E was observed for one (16.7%), M. avium complex, four (8.9%) M. fortuitum group, and one (5.9%) unidentified Mycobacterium species (Supplementary Table 1). There was no statistically significant association between the presence of probe amplification and the NTM type (Table 2).
We compared the presence of probe amplification between the two assays. Accordingly, there was a statistically significant association between both assays (X2; 5.249, P = 0.036), with 68 NTM isolates having concordant results and 19 isolates with discordant results. Considering the specific rpoB gene region covered in both assays, we compared the probe amplification between rpoB2 and Probe C, and rpoB1 with Probe A. Among 77 NTM isolates with rpoB2 probe amplification in the Xpert Ultra, 60 (77.9%) had Probe C amplification in the Xpert MTB/RIF assay with a statistically significant association (X2; 6.545, P = 0.011). In addition, among six NTM isolates with rpoB1 probe amplification in the Xpert Ultra assay, four (66.7%) also had Probe A amplification on the Xpert MTB/RIF assay (X2; 29.932, P < 0.001) (Supplementary Table 2).
The CT values for the amplified probes per NTM species
Among the 77 NTM isolates with at least one amplified probe, 61 (79.2%) had a detectable CT value. Whereas, there was probe amplification without a detectable CT value in 16 (20.8%) NTM isolates with probe amplification. These 16 NTM isolates had observable probe amplification curves as observed in the graph, but there was no measurable signal (CT value = 0.0). Figure 2 illustrates an example of probe amplification with detectable and undetectable CT values. All of the NTM isolates (10, 100%) with rpoB4 amplification had detectable CT values. Whereas, among NTM isolates with rpoB2 amplification and rpoB1 amplification, 79.2% (61) and 83.3%5 had detectable CT values, respectively. Per the specific NTM species, there was a detectable CT value for all M. simiae (8,100%) and M. gordonae (7, 100%) isolates. Among 17 unidentified Mycobacterium species, 11 had probe amplification, and all had detectable CT values. Among 41 M. fortuitum isolates with probe amplification at rpoB2, 68.3% (28) had detectable CT value, and the remaining 13 (31.7%) had rpoB2 amplification without detectable CT value. Of four M. avium complex isolates with probe amplification, three isolates with both rpoB1 and rpoB2 amplification had detectable CT values. The other M. avium complex isolate had rpoB2 amplification without detectable CT value. The individual cases of M. celatum, M. scrofulaceum, M. asiaticum, and M. ulcerans had probe amplification with detectable CT values.

A pictorial example of amplified probes from NTM isolates in the Xpert Ultra assay taken from the GeneXpert machine. One figure (A) showed rpoB2 and rpoB4 amplified with detectable CT value, whereas the other figure (B) showed rpoB2 amplified but no detectable CT value.
The median CT value for the rpoB2 probe was 28.3, which ranged from 16.5 to 38.9 (IQR; 11.3). For rpoB4, the CT value ranged from 22.6 to 38.3 with a median value of 30.55 (IQR; 7.9). The median CT value for the rpoB1 probe was 30.9, which ranged from 21.5 to 35.8 (IQR; 11.1). The median CT values for rpoB2 in M. fortuitum, M. simiae, M. gordonae, and unidentified Mycobacterial species were 27.7 (IQR = 10.9, range = 18.6–38.9), 34.55 (IQR = 5.3, range = 31.7–37.0), 21.5 (IQR = 8.7, range = 16.5–29.3), and 30.8 (IQR = 11.2, range = 19.4–38.6), respectively. Since rpoB2 was amplified in most of the NTM species, we compared the median CT values using the Box-Plot and Kruskal-Wallis test. There is a statistically significant difference in the median CT value for rpoB2 among the NTM species (X2 = 18.857, p = 0.016) (Fig. 3; Table 3). The rpoB2 CT values for single M. scrofulaceum, M. ulcerans, M. celatum, and M. asiaticum isolates were 20.5, 24.3, 25.9, and 17.6, respectively. The rpoB2 CT values for three M. avium complex isolates were 26.1, 35.9. and 29.2.
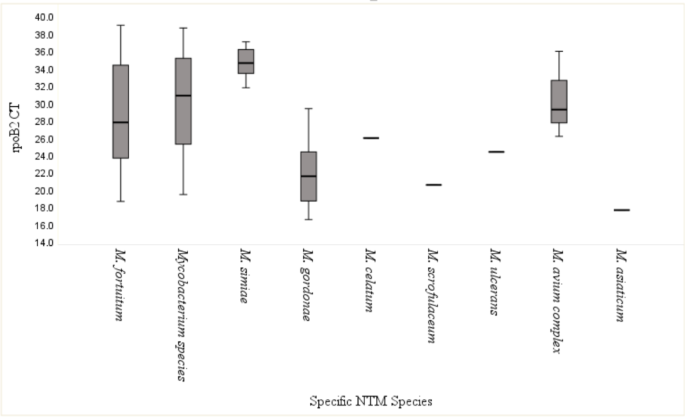
Box plot for CT values of rpoB2 per NTM species. The rpoB2 CT value for the specific NTM species was presented using both plots. M. simiae had higher median CT values, and M. scrofulaceum and M. gordonae had lower CT values.
In the case of rpoB4, the median CT value for the six M. gordonae isolates was 30.0 (IQR = 9, range = 22.6–30.9). The CT values for the two unidentified Mycobacterium species with rpoB4 amplification were 30.2 and 31.1. Whereas, the CT value for a single M. fortuitum isolate with rpoB4 amplification was 38.3, and for the M. asiaticum isolate, it was 24.5. The difference in the rpoB4 CT value among NTM species was not statistically significant (X2 = 3.673, P = 0.299) (Table 3).
Among 68 NTM isolates with probe amplification, 36 (52.9%) had a CT value, and the remaining 32 (47.1%) had probe amplification without a detectable CT value. Specifically, 31 (48.4%), one (16.7%), and all (7, 100%) isolates with Probe C, Probe E, and Probe A amplification had a CT value, respectively. Specifically, the median CT value for Probe C was 29.2 (range: 21.2, IQR: 6.3, Min: 19.6, Max: 40.8). The median CT value for Probe A was 26.3 (range: 5.4, IQR: 3.1, Min: 23.0, Max: 28.4). The median CT value for Probe C for M. fortuitum was 31.9 (range: 17.2, IQR:6.9, Min; 23.6, Max; 40.8). Whereas, the median CT value for Probe C for M. gordonae was 25.9 (range: 6.8), ranging from 19.6 to 26.4. The median CT value for Probe C for unidentified Mycobacterium species was 27.7 (range: 10.1, IQR: 4.5, Min: 25.6, Max: 35.7). The median CT value for Probe A for M. avium complex was 26.3 (range: 3.1, IQR: 2.1), ranging from 25.0 to 28.1. There was a statistically significant median CT value difference for Probe C among the NTM species (X2; 13.199; P-value = 0.041). But, the difference was not statistically significant for Probe A (X2; 3.857; P-value = 0.145) (Table 3).
Probe amplification using NTM reference ATCC strains
The seven ATCC NTM strains included M. fortuitum, M. chelonae, M. terrae, M. abscessus, M. avium, M. kansasii, and M. scrofulaceum. The Xpert Ultra assay result for all these NTM isolates was MTB Not Detected. Any probe amplification was found for five of them, and all had rpoB2 probe amplification. Probe amplification was not observed for M. chelonae and M. abscessus. For M. kansasii, additional probe amplification was observed at rpoB1 and rpoB4. Comparably, a lower CT value for rpoB2 was observed for M. terrae and M. kansasii, and a higher CT value was observed for M. avium and M. fortuitum (Table 4).
Amplified probe CT value comparison between NTM and MTBC
Sixty-two MTBC isolates identified from DM and CKD patients were also run in the Xpert Ultra assay using the same protocol used for the NTM isolates. All the MTBC isolates had amplification for IS1081/IS6110 and all four rpoB probes (rpoB1, rpoB2, rpoB3, and rpoB4). The median CT values for IS1081/IS6110, rpoB1, rpoB2, rpoB3 and rpoB4 were 16.50 (IQR = 1, Range = 15.9–20.9), 17.5 (IQR = 1, Range = 16.5–26.6), 17.40 (IQR = 1, range = 16.5–25.4), 18.8 (IQR = 1, range = 17.3–27.8), and 19.5 (IQR = 3, range = 16.5–29.0), respectively. The median CT values for rpoB2 and rpoB4 probes were lower (higher bacillary load) for MTBC compared to the CT values in the NTM species (lower bacillary load) (for rpoB2; X2 = 203.5 and P < 0.001, for rpoB4; X2 = 9.00 and P < 0.001) (Supplementary Table 3).
Probe amplification observed for clinical specimens
Analysis was conducted on all 97 specimens collected from DM and CKD patients that were negative in the Xpert Ultra assay and had at least one amplified probe. The amplified probes were rpoB2 (93, 95.88%), IS1081/1S6110 (5, 5.15%), and rpoB4 (1, 1.03%). Ninety-two and four samples had amplification only at rpoB2 and IS1081/1S6110, respectively. The remaining sample had amplification at the three probes (IS1081/1S6110, rpoB2, and rpoB4). All 93 samples with the rpoB2 amplified probes had detectable CT values with a median CT value of 37.0 (IQR: 4, range: 25–40). Half of them had rpoB2 CT values above 36.57. Whereas, among the five samples with IS1081/IS6110 amplification, three had detectable CT values of 37.2, 37.9, and 39.9, while two had amplification without detectable CT value (Supplementary Table 4).
Later, NTM was identified in the culture of 13.40%13 of the specimens that had probe amplification with a negative Xpert Ultra assay result. Based on the Genotype CM/AS assay, 10 of 13 had valid results, and the identified specific NTMs were M. fortuitum (8, 80%), M. simiae (1, 10%), and M. scrofulaceum (1, 10%). Among these 13 NTM cases, 11 were detected in specimens with rpoB2 amplification, one was detected from a specimen that had amplification only at IS1081/IS6110, and the remaining one case was detected in a specimen that had IS1081/IS6110, rpoB2, and rpoB4 probe amplification (Supplementary Table 4).
The CT value of rpoB2 for the samples with probe amplification later identified to have NTM was lower compared to the CT value for the samples with probe amplification and had culture-negative results (X2 = 2.949, P = 0.015) (Supplementary Table 5). The median CT value for the 12 samples with rpoB2 amplified and found to have NTM was 34.57 (IQR = 3, range = 28–39).
Effect of NTM and MTBC mixed infections and bacteria on probe amplification
Seven NTM ATCC strains were mixed with MTBC (H37Rv) at different concentrations (1.5 × 10⁸ CFU/mL and 1.5 × 10² CFU/mL) and tested using the Xpert Ultra assay. Mixed NTM and H37Rv spiked isolates did not have an effect on the probe amplification and drug-resistance determination in the Xpert Ultra assay. All the tested spikes had probe amplification for all probes and gave MTB Detected Rifampicin Resistance Not Detected results (Supplementary Table 6). In addition, we have tested 10 bacteria, comprising five gram-positive and five gram-negative bacteria, to assess the status of rpoB probe amplification and associated CT values in the Xpert Ultra assay. All had negative (MTB Not Detected) results with no probe amplification (Table 5).


