Participants
A group of 116 healthy participants, vaccinated with the 2-dose primary SARS-CoV-2 vaccination cycle, followed by a booster ~5–7 months later, was included in the study, as described in Table 1. Among them, 36 (31.03%) were male and 80 were female (68.97%), with a median age of 49 (range: 24–81). Eighty-two participants (70.69%) received mRNA vaccines during their 2-dose primary vaccination cycle (mRNA-1273 or BNT162b2), and 34 (29.31%) an adenovirus-based vaccine (ChAdOx1 nCoV-19, AZD1222). As for the booster dose, all participants received the Wuhan original monovalent mRNA vaccines. Sixty-eight participants (58.62%) never self-reported a SARS-CoV-2 infection, while 48 participants (31.38%) self-reported a previous SARS-CoV-2 infection. Among them, 9 (18.75%) self-reported infection before the booster dose, and 39 (81.25%) self-reported an infection after the booster dose.
Long-term immune response upon SARS-CoV-2 vaccine booster dose
To determine the long-term immunity generated by the vaccine and/or infection, the spike- and RBD-specific immune responses, targeting the wt strain, the Delta, Omicron BA.1 and Omicron BA.2 variants, a blood sample was collected 6 months following the booster dose. Compared to pre-boost, a significant increase in the wt spike-specific IgG levels was detected at post-boost (median values of 582.6 [210.5–1218] and 6847 [2791–14988] ng/ml, respectively, ***P < 0.001; Fig. 1a). Upon boosting, IgG levels specific for the wt spike were similar to the ones specific for the spike of the BA.2 variant (median of 7547 [2773–12886] ng/ml, respectively), and significantly higher compared to those specific for the Delta and Omicron BA.1 variants (median of 4457 [1850–8813] and 2125 [935.3–4265] ng/ml, *P = 0.028 and ***P < 0.001, respectively; Fig. 1b). The IgG response specific for the wt RBD was also significantly higher compared to the one specific for Omicron BA.1 and BA.2 RBD (median of 10314 [4462–20192], 3548 [1241–7344] and 3170 [1206–7361] ng/ml, respectively; ***P < 0.001; Fig. 1c). The functionality of the spike-specific antibodies was assessed via their ability to block the RBD/ACE-2 interaction, employing a sVNT. Upon the booster dose, a significantly higher number of participants developed antibodies with binding inhibition capacity above the threshold value compared to the pre-boost analysis, for all viral variants (***P < 0.001, Fig. 1d). Nevertheless, when comparing the binding inhibition capacity after the booster dose, a significant difference was observed between Omicron BA.1 and wt strain values (###P < 0.001; Fig. 1d). The frequency of circulating wt RBD-specific B cells, identified among non-naïve CD19+ B cells (gating strategy in Supplementary Fig. 1) was similar before and 6 months after the booster administration (0.21 [0.11–0.34] and 0.17 [0.08–0.3] % of CD19+ cells, respectively; Fig. 1e). Nevertheless, upon in vitro stimulation, the amount of wt spike-specific IgG-secreting MBC was significantly higher at 6 months post-boost compared to pre-boost (2.52 [1.70–3.79] and 0.28 [0.09–1.02] % of total IgG-secreting cells respectively, ***P < 0.001; Fig. 1f).
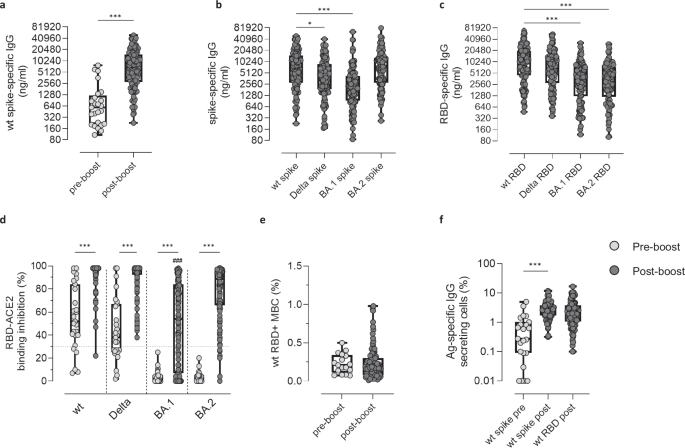
Antigen-specific humoral and cellular immune responses were evaluated in 116 participants 6 months after the booster dose (post-boost) and compared to pre-boost data. a Wt Spike-specific IgG assessed pre- and post-boost. Post-boost analysis of IgG specific for spike (b) and RBD (c) targeting the wt strain and the Delta, Omicron BA.1 and Omicron BA.2 variants. IgG concentrations, detected by ELISA, were expressed in ng/ml. d sVNT assay used to evaluate the capacity of plasma antibodies to bind the RBD of the wt, Delta, Omicron BA.1 and Omicron BA.2 strains thus blocking its interaction with ACE-2, at pre (light gray dots) and post boost (dark gray dots). Data are reported as RBD/ACE-2 binding inhibition percentage. A threshold (dotted red line), placed at 30% inhibition percentage, was used to discriminate between positive and negative samples. e Frequencies of wt RBD+ B cells, analyzed by multiparametric flow cytometry. Data are reported as percentage of total CD19+ cells of each subject. f Frequencies of spike- (for both pre- and post-boost time points, light gray and dark gray dots, respectively) and RBD-specific IgG secreting cells (for the post-boost time point, dark gray dots), assessed by Memory B cell ELISpot. Frequencies are reported as a percentage of total IgG secreting cells. Data are shown as box and whiskers plot showing the minimum and maximum of all the data. Statistical differences between groups were assessed using Unpaired Mann–Whitney test (a, e and f), Kruskal-Wallis test followed by Dunn’s post-test for multiple comparisons (b and c). Fisher’s exact test was used to assess differences in the number of individuals who are positive for the sVNT between pre- and post-boost data (*P < 0.05; ***P < 0.001) and for the wt strain versus Delta, Omicron BA.1 and BA.2 viral variants at post-boost (###P ≤ 0.001, d). *P < 0.05; ***P < 0.001. MBC, memory B cells. Sample size: pre-boost (a: n = 25; d: n = 27; e: n = 17; f: n = 23); post-boost (a–f: n = 116).
In conclusion, the immunological analysis performed 6 months after the booster dose highlighted the critical role of the third vaccine dose in enhancing both the humoral and antigen-specific B cell responses, not only against the spike/RBD antigens of the wild type strain, but also of the Delta and Omicron variants. However, the wide IQR values across all variables indicated a considerable dispersion of data, suggesting a heterogeneous response.
Dimensionality reduction and Gaussian mixture clustering identify high and low responders
To explore post-boost data in an unsupervised manner, the 12 serological variables previously analysed for each participant (reported in Supplementary Table 1) were computationally processed. To capture complex and non-linear relationships within this 12-dimensional feature space and obtain a meaningful two-dimensional representation, two distinct dimensionality reduction techniques, namely UMAP and tSNE, were employed. Following dimensionality reduction, the application of the unsupervised Gaussian Mixture Model (GMM) clustering algorithm identified, in both UMAP- and tSNE-derived embeddings, two distinct clusters –configuration yielding the lowest BIC value– of immune response. To quantitively compare the clustering performances of the two approaches, Within-Cluster Sum of Squares (WCSS) and Average Silhouette Width were computed. The WCSS values were 693.39 for the UMAP-GMM strategy and 494.39 for the tSNE-GMM strategy, indicating greater intra-cluster compactness in the latter. Similarly, the Average Silhouette Width was higher for the tSNE-based approach (value of 0.63) compared to the UMAP-based one (value of 0.56), reflecting better-defined clusters. Given these results, the tSNE-GMM strategy was selected for downstream analyses and its visual representation is showed in Fig. 2a.

a Participants represented in a dimensionality tSNE-reduced space derived from 12 serological variables. Clusters were identified using an unsupervised Gaussian-Mixture model. Each dot represents a single participant, and the colors represent distinct detected clusters. Spike (b) and RBD (c) specific IgG targeting the wt, Delta, Omicron BA.1 and Omicron BA.2 strains. IgG concentrations, detected by ELISA, were expressed as ng/ml. d sVNT assay used to evaluate the capacity of plasma antibodies to bind the RBD of the wt, Delta, Omicron BA.1 and Omicron BA.2 strains, thus blocking its interaction with ACE-2. Data are reported as RBD/ACE-2 binding inhibition percentage. A threshold (dotted red line), placed at 30% inhibition percentage, was used to discriminate between positive and negative samples. Data are shown as box and whiskers plot showing the minimum and maximum of all the data. Unpaired Mann–Whitney test was used to assess statistical differences between high (HR) and low responders (LR) in (b, c). Differences in the number of HR and LR participants who are positive for the sVNT against the wt strain and the other viral variants were assessed using Fisher’s exact test (d). **P ≤ 0.01; ***P ≤ 0.001. LR, low responders (cluster 1); HR, high responders (cluster 2). Sample size: cluster 1 (a: n = 57); cluster 2 (a: n = 59); HR (b–d: n = 59); LR (b–d: n = 57).
tSNE-GMM cluster 2 consistently exhibited a significantly higher IgG response against wt, Delta, Omicron BA.1 and Omicron BA.2 spike and RBD antigens (Fig. 2b, c, ***P < 0.001), and a significantly higher proportion of participants exhibiting positive values for the RBD/ACE-2 binding inhibition against Omicron BA.1 and BA.2 variants compared to tSNE-GMM cluster 1 (Fig. 2d, ***P < 0.001 for the BA.1 variant, *P = 0.012 for the BA.2 variant). Consequently, tSNE-GMM cluster 2 is hereafter referred to as High Responders (HR) group and tSNE-GMM cluster 1 as Low Responders (LR) one.
The potential impact of clinical and demographic variables including gender, age, vaccine formulations, past infections and time since infection was evaluated to determine their potential influence on classification into HR and LR. Age, gender and vaccine formulations did not reveal to act as influential variables on cluster categorization (P > 0.05, Table 1), while a significantly higher frequency of participants who experienced a self-reported infection were classified as HR (71% of self-reported infected participants, ***P < 0.001).
Among self-reported Infected participants (sI) clustered within HR and LR, a statistically significant difference was observed when comparing the days elapsed from the last infection to the 6 months post-boost blood sample collection (Fig. 3a and Table 1). Indeed, infected participants among the HR group contracted the infection more recently than those falling into the LR one (median value = 94 days; IQR 31–151.5 days for sI-HR, versus median value = 180.5 days; IQR 73–534.5 days for sI-LR, *P = 0.037).

a Impact of the time elapsed since self-reported infection on the classification as HR (sI-HR) and LR (sI-LR). b Frequencies of N-specific IgG secreting MBC among sNI participants categorized as HR (sNI-HR) and LR (sNI-LR). Frequencies are reported as a fraction of total IgG-secreting MBC. c N-specific IgG targeting the Omicron BA.2 variant among sNI-HR and sNI-LR. IgG concentrations, detected by ELISA, were expressed as area under the curve (AUC). Data are shown as box and whiskers plot showing the minimum and maximum of all the data. Unpaired Mann–Whitney test was used for assessing the statistical difference between groups. *P ≤ 0.05; **P ≤ 0.01. sI, self-reported infected participants; sNI, self-reported non-infected participants; sI-LR and sI-HR, self-reported infected participants who were clustered as low and high responders respectively; sNI-LR and sNI-HR, self-reported non-infected participants who were clustered as low and high responders respectively; N, nucleocapsid; AUC, area under the curve; MBC, memory B cells. Sample size: sI-LR (a: n = 14); sI-HR (a: n = 34); sNI-LR (b: n = 41; c: n = 43); sNI-HR (b, c: n = 25).
Given the high proportion of asymptomatic and mildly symptomatic infections associated with the emergence of Omicron variants10, it was investigated the possibility that some self-reported Non-Infected participants within the High Responders group (sNI-HR) might have experienced unrecognized infections. This possibility was corroborated by the observation that sNI-HR showed significantly higher frequencies of N-specific MBC compared to self-reported Non-Infected participants within the Low Responders group (sNI-LR, median value of 0.03% versus 0.00% respectively; *P = 0.013; Fig. 3b). Moreover, sNI-HR tended to exhibit higher N-specific antibody response compared to sNI-LR, although not statistically significant (median AUC value of 0.73 and 0.61 respectively; P > 0.05; Fig. 3c). This suggested the potential presence of participants unaware of their infection.
Identification of unaware infected individuals via machine learning classifiers
To identify Unaware Infected participants (UI), a predictive model was developed leveraging three distinct Machine Learning classifiers, namely k-NN, SVM-RBF and RF. These models were trained to distinguish immunological profiles of infected and non-infected individuals based on 13 serological variables (reported in Supplementary Table 1). The analysis comprised the Model Construction phase, performed on k-NN, SVM-RBF and RF classifiers, and the Model Application phase, implemented using a majority voting-based consensus approach of the three classifiers (Fig. 4).

a The study cohort (116 individuals) was initially filtered to include only those with complete serological and B-cell data. For the Model Construction (mc) phase, a subset of participants was selected as a representative cohort of infected (mcI) and non-infected (mcNI) individuals, forming the labeled dataset. b Inclusion criteria for mcI participants required a positive swab along with a frequency of N-specific MBC/106 cells > 6 and an AUC for IgG anti-N > the pre-vaccination mean plus two standard deviations (threshold=0.981 AUC value). c mcNI participants were defined by the absence of a self-reported infection, a null frequency of N-specific MBC/106 cells and an AUC for IgG anti-N ≤ than the pre-vaccination mean (threshold = 0.603 AUC value). Machine Learning classifiers employed in this phase included k-NN, SVM-RBF and RF. The Model Application phase was conducted on the remaining participants for whom all serological and B cellular variables were assessed but who did not meet the inclusion criteria for Model Construction and whose non-infection status remained uncertain (unlabeled samples). sI, self-reported infected participants; sNI, self-reported non-infected participants; mcI, representative group of sI used for Model Construction; mcNI, representative group of sNI used for Model Construction; I, sI participants classified by the model as infected; UI, sNI participants classified by the model as infected; NI, sNI participants classified by the model as non-infected; k-NN, k-Nearest Neighbors; SVM-RBF, Support Vector Machines with Radial Basis Function kernel; RF, Random Forest.
Model construction
From the initial cohort of 116 individuals, 25 were excluded due to incomplete serological and B cell data, as these variables were essential for the subsequent Model Construction and Application phases respectively (Fig. 4). This reduction resulted in a subset of 91 individuals. Based on predefined criteria—positive swab results, N-specific memory B cells, and anti-N IgG values (as detailed in the Methods and Materials – Classification Models section)—a subset of 34 participants was selected, comprising 18 mcI (model construction Infected individuals) and 16 mcNI (model construction Non-Infected individuals) participants. The clinical characteristics of these subgroups are reported in Table 2. These 34 participants were used to train and evaluate the three classifiers, k-NN, SVM-RBF and RF, via a 5-fold cross-validation strategy, with 70% of the data allocated for model training and the remaining 30% for testing. The classification performance of each model during this phase is reported in Table 3, demonstrating that all three models achieved optimal performances. Variable importance analysis across all three models identified Omicron BA.2 N-specific IgG AUC values, Omicron BA.2 spike-specific IgG concentrations and ACE2-BA.1 RBD binding inhibition percentages as the most important features (Table 4). However, some differences were observed in the feature importance attribution across classifiers. While the k-NN did not highlight any additional informative feature beyond those shared across models, both the SVM-RBF and the RF models assigned non-zero importance scores to a broader subset of serological variables (Table 4). In particular, the SVM-RBF assigned a zero importance score to wt spike-specific concentrations, as well as wt and Delta RBD-specific IgG concentrations, whereas the RF model excluded only the ACE2-wt RBD binding inhibition percentages. However, all three classifiers demonstrated high predictive performances and were thus retained for downstream analysis and included in the consensus-based approach during the Model Application phase.
Model application
k-NN, RF, and SVM-RBF pre-trained models were independently applied to the remaining 57 participants that did not meet the inclusion criteria of Model Construction phase and whose non-infection status was uncertain (Fig. 4). Among the 57 analysed participants, whose clinical and demographic characteristics are reported in Table 2, 18 self-reported Infection (sI) and 39 self-reported a Non-Infection (sNI). The application of the majority-voting consensus among the outputs of the three models correctly identified 16 out 18 self-reported Infected individuals, yielding a Recall of 0.89 in this Model Application phase. Recall was the only performance metric that could reliably be assessed, given the uncertainty regarding the non-infection status of the remaining participants. These 16 individuals, who self-reported a previous infection and were correctly identified by the consensus strategy, will be referred to as Infected (I). Among the 39 sNI participants, 14 were classified as infected and therefore referred to as Unaware Infected (UI). The remaining 25 participants were confirmed and classified as Non-Infected (NI) (Fig. 4).
To further confirm the UI classification assigned by the consensus strategy, the frequency of N-specific MBC, assessed by ELISPOT, was compared between the UI and NI groups. Participants classified by the consensus approach in the UI group showed a statistically significant higher frequency of N-specific MBC compared to NI participants (median 0.09% and 0% respectively; **P = 0.003; Supplementary Fig. 2), confirming an unaware infected profile. In summary, the application of this strategy allowed for the reliable identification of 14 participants with an unreported infection history based on their immunological profiles, demonstrating its potential to uncover hidden infection status.
Characterization of the immunological profile of participants stratified in Infected, Unaware Infected and Non-Infected participants
The immunological response was analysed based on the stratification of participants into the I, UI and NI groups as determined by the consensus strategy. The 2 participants self-reported Infected but erroneously classified by the model as NI, along with the 34 used for the Model Construction phase (mcI and mcNI) were excluded from this analysis. Participants classified as UI exhibited levels of IgG specific for wt and BA.2 RBD (median of 27,311 and 9487 ng/ml, respectively) comparable to participants classified as I (median of 21,914 and ng/ml and 8876 ng/ml, respectively). Moreover, their IgG levels were statistically higher compared to NI participants (median of 5710 and 2188 ng/ml for wt and BA.2 RBD-specific IgG; ***P < 0.001; Fig. 5a, b), while no significant differences in the proportion of participants above the binding inhibition threshold value were observed between groups (all P > 0.05; Fig. 5c, d). Similar results were observed when the analysis was performed for the serological response specific for Delta and BA.1 variants (Supplementary Fig. 3). A statistically significant higher frequency of wt RBD+ B cells was observed in I and UI (median of 0.27% and 0.28%) compared to the NI group (median of 0.16%; *P = 0.018 and **P = 0.005 respectively; Fig. 5e). Participants classified as I and UI also presented statistically higher frequencies of circulating IgG secreting RBD-specific MBC capable of reactivating upon in vitro stimulation compared to NI participants (median frequency of 4.55% in I, 3.71% in UI and 1.54% in NI; ***P < 0.001; Fig. 5f).

Humoral and B cellular RBD-specific immune responses were analysed in self-reported infected participants classified as infected (I), and in self-reported non-infected participants classified as Unaware Infected (UI) and as non-infected (NI). a RBD-specific IgG targeting the wt strain and b the Omicron BA.2 variant are reported as ng/ml. c sVNT used to assess the capacity of plasma antibodies to bind the RBD of wt, and d Omicron BA.2 strains. Data are reported as RBD/ACE-2 binding inhibition percentage. A threshold (dotted red line), placed at 30% inhibition percentage, was used to discriminate between positive and negative samples. e Frequencies of wt RBD+ B cells, analyzed by multiparametric flow cytometry. Data are reported as fraction of total CD19+ B cells of each subject. f Frequencies of wt RBD-specific IgG secreting cells, evaluated by using the ELISpot assay upon in vitro stimulation. Frequencies are reported as a fraction of total IgG-secreting cells. Data are shown as box and whiskers plot showing the minimum and maximum of all the data. Kruskal-Wallis test, followed by Dunn’s post-test for multiple comparisons, was used for assessing statistical differences between I, UI and NI groups (a, b, e, f). Differences in the number of I, UI and NI participants who are positive for the sVNT against the wt strain and the Omicron BA.2 variant were assessed using Fisher’s exact test (c, d). The individual data points in white (mcI) and black (mcNI) represent the median value of the representative group of self-reported infected and self-reported non-infected participants used in the Model Construction phase respectively, and were not included in the statistical analyses. **P ≤ 0.01; ***P ≤ 0.001. sI, self-reported infected participants; sNI, self-reported non-infected participants; mcI, representative group of sI used for Model Construction; mcNI, representative group of sNI used for Model Construction; I, sI participants classified by the model as infected; UI , sNI participants classified by the model as infected; NI, sNI participants classified by the model as non-infected; MBC, memory B cells; wt RBD+, wt RBD-specific B cells. Sample size: mcI (a–f: n = 18); I (a–f: n = 16); UI (a–f: n = 14); NI (a–f: n = 25); mcNI (a–f: n = 16).
To compare the phenotypes of the RBD+ B cells developed among the I, UI and NI groups, the SOM clustering algorithm was applied to the multidimensional flow cytometry data (Fig. 6). According to the combination of the expression of 7 markers (IgD, CD27, CD21, CD38, IgM, IgA, IgG), 12 MBC clusters were identified among the total CD19+ no naïve B cells, and grouped in Ig-switched MBC (IgD– CD27+), plasmablast/plasma cells (PB/PC; IgD– CD38+), double negative (DN; IgD– CD27–) and unswitched MBC (IgD+ CD27+) (Fig. 6a). Most of the RBD+ B cells fell into IgG+ resting MBC (cluster 3), DN CD21+ MBC (cluster 4), DN CD21– MBC (cluster 12) and IgG+ activated MBC (cluster 13) (Fig. 6b). When comparing the phenotypes of RBD+ B cells among I, UI and NI, statistically higher levels of RBD+ IgG+ resting B cells (cluster 3) were detected in participants belonging to the I and UI groups compared to NI (median of 24.53%, 28.1% and 14.69%, respectively, *P = 0.041 and 0.016, respectively, Fig. 6c). Conversely, NI showed statistically higher levels of RBD+ DN1 CD21+ B cells (cluster 4) compared to I (median of 37.17% and 20% respectively, *P = 0.02, Fig. 6d).

FlowSOM algorithm was used to characterize different phenotypes of memory B-cells among self-reported infected participants classified as infected (I), and self-reported non-infected participants classified as Unaware Infected (UI) and as non-infected (NI). a Heatmap of clusters from the FlowSOM analysis of total memory B-cells, with markers (IgD, CD27, CD21, CD38, IgA, IgM, IgG) reported in column, and the identified clusters in row. Clusters are grouped in Ig-switched MBC, plasmablasts/plasmacells (PB/PC), double negative (DN) and unswitched MBC. The percentage of cells positive for each marker is visualized with a color scale from blue (0%) to red (100%). A bubble plot reported the size of each cluster, with circle areas proportional to the number of cells included in each cluster. b Median frequencies of wt RBD+ B cells in each clusters reported as a fraction of total wt RBD+ B cells in a color scale from black (lowest value) to light yellow (highest value). c Frequencies of wt RBD+ B cells within cluster 3 (IgG+ resting) and d cluster 4 (DN CD21+IgG+), expressed as a fraction of wt RBD+ B cells in each sample. Data are shown as box and whiskers plot showing the minimum and maximum of all the data. Kruskal-Wallis test, followed by Dunn’s post-test for multiple comparisons, was used for assessing statistical differences between I, UI and NI groups. The individual data points in white (mcI) and black (mcNI) represent the median value of the representative group of self-reported infected and self-reported non-infected used to train the consensus model respectively, and were not included in the statistical analyses. *P ≤ 0.05. sI, self-reported infected participants; sNI, self-reported non-infected participants; mcI, representative group of sI used for Model Construction; mcNI, representative group of sNI used for Model Construction; I, sI participants classified by the model as infected; UI, sNI participants classified by the model as infected; NI, sNI participants classified by the model as non-infected; wt RBD+, RBD wt-specific B cells. Sample size: mcI (c, d: n = 18); I (c, d: n = 16); UI (c, d: n = 14); NI (c, d: n = 25); mcNI (c, d: n = 16).


