Results of the TGEV S protein dominant epitope screening
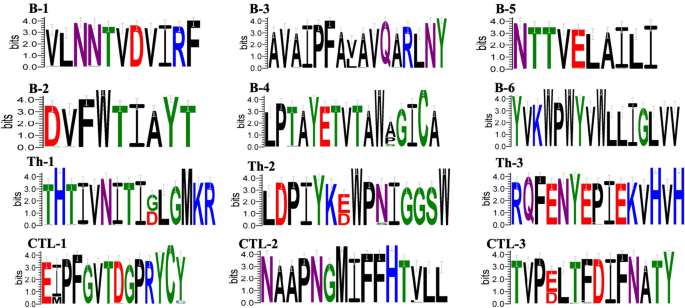
From the 1448 amino acids of S protein obtained from NCBI (The complete amino acid sequence is shown in supplemental table S1), CTL dominant epitopes were identified using the NetMHCpan-4.1 and NetMHCpanEL4.1 dual servers, revealing three overlapping dominant epitope regions. The dominant epitopes were analyzed via the NetMHCIIpan-4.0 server and further evaluated by IFNepitope and IL4pred server, identifying three overlapping dominant epitope regions. Screening with the ABCpred and PEPTIDES servers revealed six overlapping linear B-cell epitope regions. All identified dominant epitopes were confirmed as non-toxic peptides by the ToxinPred server and highly immunogenic (immunogenicity score > 0.25) by the IEDBMHC-I server. Conservation analysis conducted by the IEDB server indicated high conservation of linear B-cell dominant epitopes with Th-2 and Th-3 across all 45 sequences (The S protein GenBankID of 45 strains was shown in supplemental table S2), while CTL dominant epitopes showed less conservation with Th-1 (Detailed scores for conservative analysis are shown in supplementary table S3). Nonetheless, considering their significance in vaccine molecular design, they were included in the study. The results are shown in Table 1. The analysis of amino acid residues using Weblogo showed that most of the dominant epitopes were conserved, with only a few amino acid residues experiencing mutations, as shown in Fig. 2. In the analysis of epitope hiding, it was found that all the selected epitopes except B-6 epitopes were located externally (The complete extracellular region of S protein is shown in supplementary figure S8).
TGE S protein vaccine construction
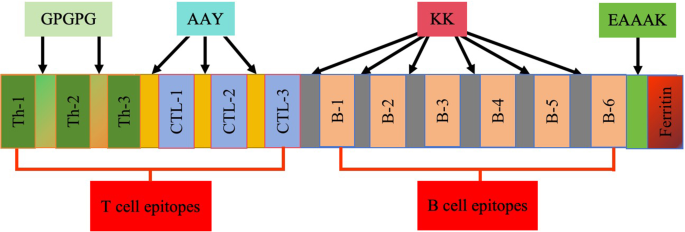
Based on the above analytical screening, the candidate nanoparticle vaccine was designed by selecting the above T-cell and B-cell potential epitopes for vaccine construction. Figure 3 illustrates the selection of 12 dominant epitopes. Th epitopes were connected using GPGPG flexlinker, CTL epitopes using AAY flexlinker, and B-cell epitopes using KK flexlinker. Additionally, the ferritin N-terminus was tandemly linked with the C-terminus of the dominant epitope B-6 using EAAAK flexlinker to form the complete candidate nanoparticle vaccine (The amino acid sequence of the candidate vaccine is shown in supplemental Table S4).
Assessment of candidate nanoparticle vaccine
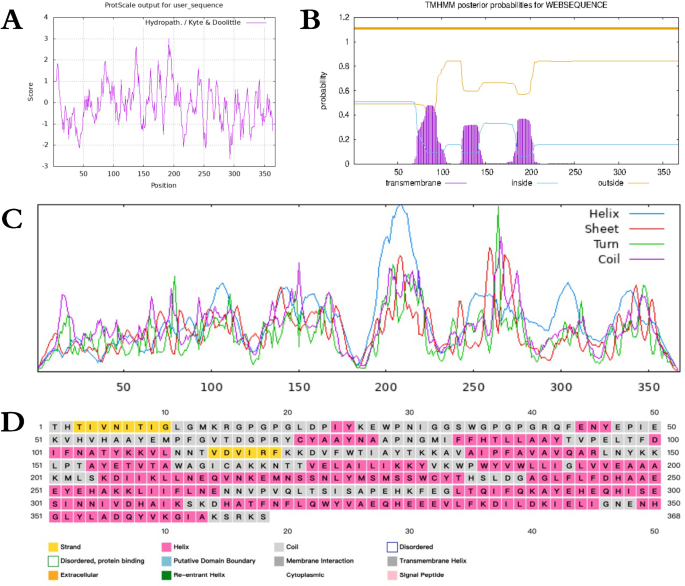
The antigenicity evaluation of the candidate nanoparticle vaccine yielded a score of 0.752474 using the ANTIGENpro server. Solubility analysis during overexpression indicated a score of 0.647714 via the SOLpro server. Additionally, the AllerTop server confirmed the non-sensitizing nature of the candidate nanoparticle vaccine, indicating its antigenicity, solubility, and non-sensitizing properties. ProtScale server analysis of hydrophobicity revealed a large number of negative regions for candidate nanoparticle vaccines, and the results are shown in Fig. 4A. The TMHMM-2.0 server analyzed the transmembrane structural domains in the candidate nanoparticle vaccine were all extracellular regions, and the results are shown in Fig. 4B, indicating that the candidate nanoparticle vaccine has hydrophilic and extracellular secretion functions. Further characterization of physical and chemical properties via the ExPASy server revealed essential parameters: the candidate nanoparticle vaccine comprised 368 amino acids, with a molecular weight of 41814.09 and a theoretical pI of 6.69. The instability index (II) computed as 28.75 classifies the protein as stable—aliphatic index as 91.47 and the Grand average of hydropathicity (GRAVY) as -0.153. The secondary structure analysis, performed using the SOPMA and PSIPRED servers, depicted a composition of Helix, sheet, Turn, and Coil, with PSIPRED indicating percentages of Alpha helix (43.75%), Extended strand (22.01%), Beta turn (8.42%), and Random coil (25.82%), as shown in Fig. 4C,D, respectively.
Results of candidate nanoparticle vaccine evaluation. (A) candidate nanoparticle vaccine hydrophobicity analysis; (B) candidate nanoparticle vaccine transmembrane domain analysis; (C) candidate vaccine secondary structure analyzed by SOPMA server; (D) candidate vaccine secondary structure analyzed by PSIPRED server.
Modeling, refinement and evaluation of tertiary structures of candidate nanoparticle vaccine
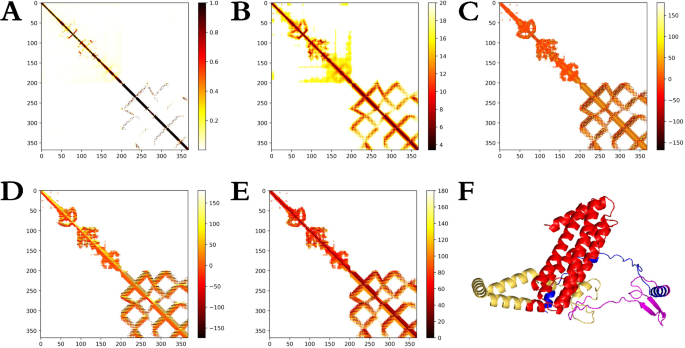
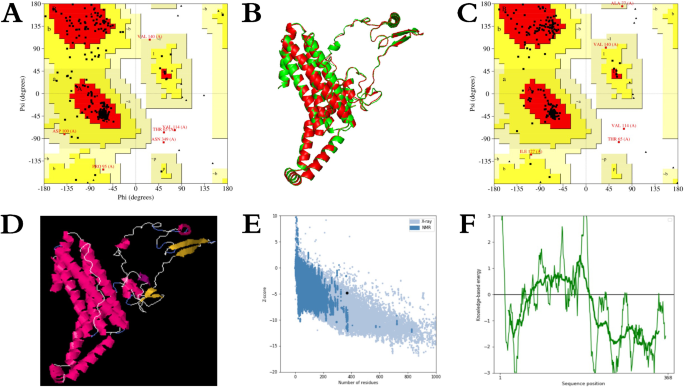
The tertiary structure of the candidate nanoparticle vaccine was generated using the trRosetta server via homology modeling, resulting in a model with a TM-score of 0.632. Visualization of the structure was performed using Pymol software, as depicted in Fig. 5F. Additionally, the trRosetta server generated a 2D view of the tertiary structure, and the results are shown in Fig. 5A–E. To ensure that the protein resembled the natural structure, the original tertiary structure model of the generated candidate vaccine was later refined using the Galaxy-Refine server (The detailed scores of the tertiary structure refinement model are shown in supplementary table S5). Structural comparisons were made using Pymol software, with results illustrated in Fig. 6B. The level of refinement pre- and post model refinement was assessed by generating Ramachandran plots of the protein’s tertiary structure using the PROCHECK server. In the crude model, 88.4% of residues fell within the most favoured regions, 10.0% in additional allowed regions, 0.6% in generously allowed regions, and 0.9% in disallowed regions, as depicted in Fig. 6A. Following refinement, the percentages shifted to 93.6%, 4.9%, 0.9%, and 0.6% for residues in the respective regions, as illustrated in Fig. 6C (The detailed comparison results before and after the tertiary structure refinement of candidate vaccines are shown in supplementary Figure S1-S5). The results demonstrate that the model quality was improved after refinement. However, further stabilization of the protein tertiary structure through disulfide engineering was deemed necessary for the refined model. This engineering was executed via the DbD2 server. Notably, the refined model displayed a B-factor of 0 in the analysis results, indicating that no sequence mutations were required to introduce disulfide bonds, as shown in Fig. 6D. The ProSA web server performed the final refined model scoring and validation, and the results are shown in Fig. 6E,F. The model exhibited a Z-Score of -4.83, followed by predominantly negative local energy scores. These findings affirm that the refined model conforms to natural protein conformation, rendering it an optimal candidate for subsequent analytical steps.
Modeling of the tertiary structure of the candidate nanoparticle vaccine. (A)–(E): Are 2D structural parameters (including Omega, Phi, Distance, Theta, and Contact); (F) The tertiary structure of the candidate nanoparticle vaccine as visualized by the Pymol software (Th-dominant epitopes are in blue, CTL-dominant epitopes are in purple, B-cell-dominant epitopes are in yellow, and ferritin is in red).
Refinement of the tertiary structure of the candidate nanoparticle vaccine. (A) Ramachandran graphic validation of the tertiary structure; (B) cartoon comparison of the before and after model structure (green for the coarse model, red for the refined model); (C) Ramachandran graphic validation of the refined tertiary structure; (D) disulfide engineering of the refined model (the yellow part is the disulfide bond); (E) ProSA SEB server Evaluating the refined model; (F) ProSA SEB server evaluating the local model quality.
Analysis of structural B cell epitopes
Ellipro server identified a total of 6 Linear epitopes and 6 discontinuous epitopes within the 368 amino acids of the candidate nanoparticle vaccine. As presented in Table 2, all predicted scores surpassed the server’s threshold of 0.5.
Docking of candidate nanoparticle vaccine molecules
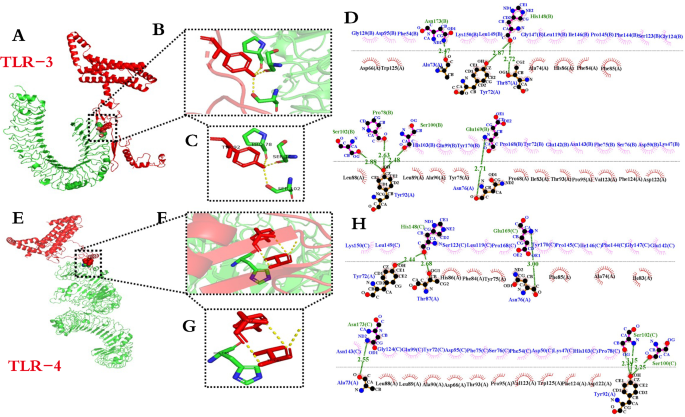
The ability of candidate nanoparticle vaccines to interact with TLRs is an important indication of defense against pathogens. To evaluate this, protein–protein docking was conducted using the pyDockWEB server. The server comprehensively ranked the complexes, with the top-ranked docked complexes selected for subsequent analysis. From the docking analysis, it is obvious that the candidate nanoparticle vaccine can be stably docked with TLR-3 and TLR-4. The composite scores (kcal/mol) for docking with TLR-3 were as follows: Electrostatics: -10.549, Desolvation: -47.666, Vdw: 86.453, with a Total score of -49.569. Pymol software was utilized to visualize the local interaction sites, as depicted in Fig. 7A–C, while LigPlot + software generated the 2D interaction interface, illustrated in Fig. 7D, There were 6 amino acid residues with hydrogen bond and 23 amino acid residues with hydrophobic interaction. The composite scores (kcal/mol) for docking with TLR-4 were as follows: Electrostatics: -9.895, Desolvation: -47.614, Vdw: 63.102, resulting in a Total score of -51.199. Pymol software was used to visualize the local interaction sites, depicted in Fig. 7E–G, while LigPlot + software generated the 2D interaction interface, illustrated in Fig. 7H, There were 6 amino acid residues with hydrogen bond and 23 amino acid residues with hydrophobic interaction. Overall, the docking analysis revealed total energy consumption scores around − 50 kcal/mol, with the two-dimensional interaction interface displaying numerous interacting amino acid residues, indicating a robust interaction between the candidate vaccine and TLR-3 and TLR-4.
Results of molecular docking of candidate nanoparticle vaccine with TLR-3 and TLR-4. (A) and (E): Docking of candidate nanoparticle vaccine with TLR-3 and TLR-4 (candidate vaccine structure is in red, TLR-3 and TLR-4 are in green); (B) and F: Magnification of local interaction position; (C) and (G) Specific interaction amino acid residues; (D) and (H): Two-dimensional interaction interface.
Molecular dynamics simulation analysis
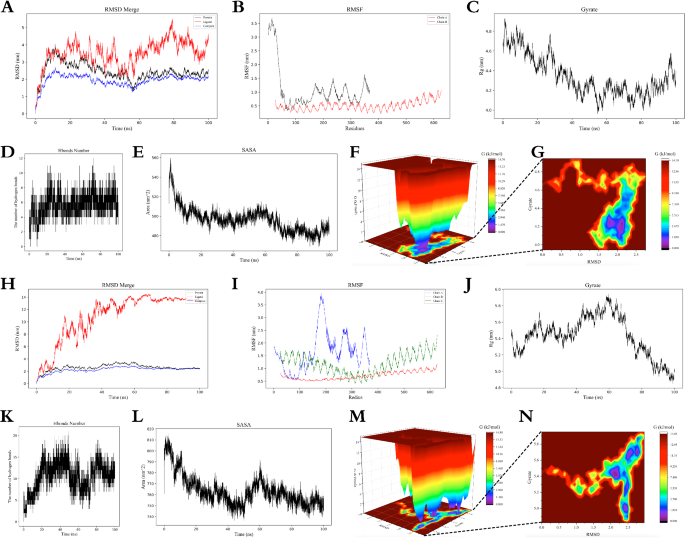
In MD simulation, Fig. 8A–G shows the results of docking complex analysis between TLR-3 and candidate vaccine, and Fig. 8H–N shows the results of docking complex analysis between TLR-4 and candidate vaccine. It can be seen from the figure that RMSD curves remain between 4–5 nm and 12–14 nm respectively after 45 ns, indicating that the complex tends to be stable during the simulation process and the structure is relatively stable. The RMSF curve Chain A showed different behaviors up to 1.5 and 4.0 nm, respectively. Most of the regions in TLR-3 showed relative stability, while some regions in TLR-4 showed higher fluctuations, which proved that the dynamic behavior of amino acid residues was more stable in the TLR-3 complex. Rg curve analysis further demonstrated the spatial conformation of the complex, and both complexes fluctuated within 100 ns. In the analysis of hydrogen bond curves, about 10 and 20 hydrogen bonds were found in 20 to 60 ns, respectively, showing strong interactions. SASA analysis showed a decline from 560 to 500 nm2 and 810 nm2 to 750 nm2 within the first 40 ns, respectively, and then remained stable, reflecting the tight binding and stability of the complex. In Gibbs free energy analysis, the 3D free energy landscape map is drawn, and the RMSD is in the range of 0.0–2.5. The Gyrate fell to 0.0–4.8 and 0.0–5.8 respectively, which further confirmed the relatively good stability of the two docking complexes.
Immune simulation of candidate nanoparticle vaccine
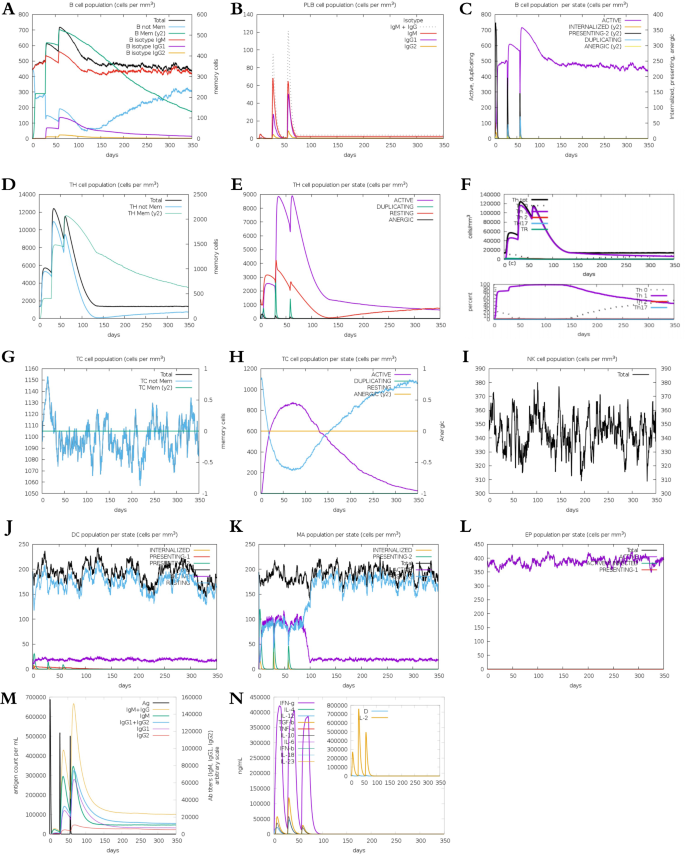
The immune simulation reaction was performed on the C-ImmSimm server, and the results are shown in Fig. 9. The candidate nanoparticle vaccine was injected three times and significantly induced primary immune responses after three injections. And three peak curves were formed, which proved that immune memory was successfully created and memory T and B lymphocytes produced a rapid response. Notably, secondary immune responses were stimulated, with gradual increments observed in primary immune responses after each subsequent injection. A marked elevation in secondary and tertiary antibody levels (IgG1 + IgG2, IgM and IgG + IgM) was observed. Furthermore, there was a continual increase in the concentration of active B cells, plasma B cells, helper T cells, and cytotoxic T cells, peaking during antigen injection, indicating effective immune responses, establishment of immune memory, and efficient antigen clearance. Increases in dendritic cells and macrophages pointed to excellent antigen presentation by antigen-presenting cells (APCs), while the candidate nanoparticle vaccine resulted in significant increases in cytokine (IFN-γ, IL-4, and IL-10) levels. Therefore, the simulated immune response demonstrated that the candidate nanoparticle vaccine elicited substantial production of immunoglobulins, APCs, cytokines, and activated B and T cells, showcasing its ability to induce potent immunogenic responses post-vaccination within the host.
Results of immune response induced by three doses of the vaccine. (A) Overall change trend of B lymphocytes; (B) Plasma B lymphocytes count; (C) B lymphocytes population per entity-state; (D) and (E) Helper t lymphocyte population; (F) Regulatory T cell population; (G) Cytotoxic T lymphocyte population; (H) Cytotoxic T-cell population per state; (I) Natural killer cell population; (J) Dendritic cell population per state; (K) Macrophages population per state; (L) EP cell population; (M) The change trend of antigen and immunoglobulin; (N) Trends of cytokines and interleukin.
Codon optimization and in-silico cloning of vaccine
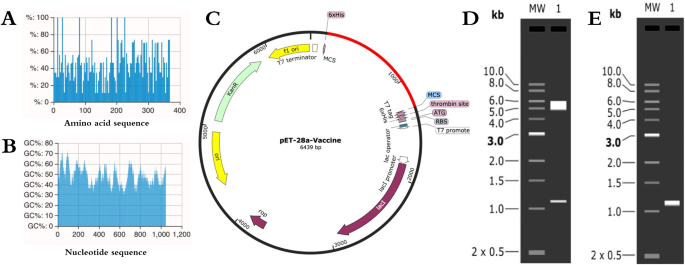
The efficient expression of candidate nanoparticle vaccines is a key step in silic cloning. Therefore, the amino acid sequences of the candidate nanoparticle vaccine were codon-optimized for prokaryotic organisms to improve their translational efficiency based on E. coli K12 in the JCat server. The full length of the nucleotide sequence of the candidate nanoparticle vaccine was 1104 bp after reverse translation (The optimization results of Escherichia coli favoritism are shown in supplementary Figure S6, The complete nucleotide sequence is shown in supplemental table S6). The CAI-Value of the improved sequence reached 1.0, while the GC-Content of E coli was at 47.92%. Upon validation using the ExpOptimizer server, the CAI was determined to be 0.74, with a corresponding GC content of 47.92%. These results, presented in Fig. 10A,B, indicated that all CAI values exceeded the threshold of 0.5, ensuring abundance in the DNA sequences. Additionally, the GC content fell within the optimal scoring range of 30 to 70%. To facilitate expression and purification, XhoI and BamHI restriction endonuclease sites were selected using SnapGene software, and the adapted nucleotide sequences were inserted into the pET28-a(+) expression vector with a 6× his tag sequence. The prokaryotic expression plasmids were constructed, and the results are shown in Fig. 10C. To verify successful insertion, the constructed plasmids underwent double enzyme digestion and PCR simulation, followed by analysis using 1% agarose gel electrophoresis. The results, shown in Fig. 10D,E, confirmed the successful insertion of the candidate vaccine, with bands observed at the correct positions (See supplementary Figure S7 for the complete agarose gel electrophoresis simulation).
Construction of the prokaryotic expression system of the candidate nanoparticle vaccine. (A) ExpOptimizer server to verify the CAI value; (B) ExpOptimizer server to verify the GC content; (C) Candidate nanoparticle vaccine (red) inserted into pET-28a(+); (D) Double enzymatic digestion of pET-28a-Vaccine plasmid (Cropped from supplemental Figure S7); (E) PCR simulation of the candidate nanoparticle vaccine Analysis (Cropped from supplemental Figure S7).

