In the following subsection, we report the number and type of participants (see “Participants” section). Additionally, we present the characteristics studied and the preprocessing of the data (see “Data description and preprocessing” section). Subsequently, we explore demographic factors, comorbidities, and symptoms observed during the acute phase of primary infection in individuals with LC-19 and non-Long COVID-19 (see “Analysis of sociodemographic factors, comorbidities andsymptoms between LC-19 patients and non-LongCOVID-19 patients” section) and the effect of the severity of infection (“Impact of COVID-19 hospitalisation on the developmentof LC-19” section). Furthermore, we assess the influence of COVID-19 vaccination (see “Effects of vaccination on LC-19” section), including dosage, administration schedules, and types of vaccines, on LC-19 prevalence. Finally, we develop a model to predict the probabilities of developing LC-19 after a COVID-19 infection by considering demographic data, pre-existing comorbidities, symptoms at initial COVID-19 diagnosis, and vaccination schedules recorded prior to 21 days before the COVID-19 positive (see “LC-19 calculator tool” section).
Participants
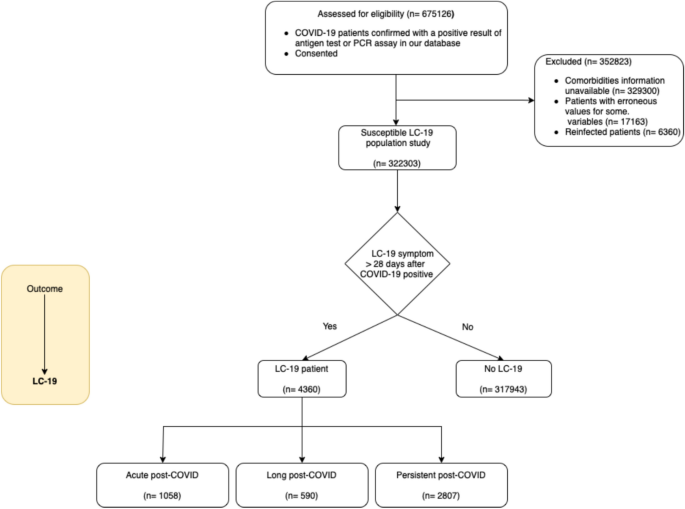
A total of 675126 patients who tested positive for COVID-19 between January 4th, 2020 and May 3rd, 2022 were available in the study (Fig. 1). The study excluded patients for whom basic information was unavailable, such as comorbidities or demographic data (number of patients ’n’ = 329300), as well as those for whom erroneous values were present in any of the available records (n = 17163). Those erroneous values were identified by searching patients with at least one of the following constraints: negative age values, age values greater than 130, unknown sex, or multiple administrations of the vaccine dose in a single day. Furthermore, patients who have experienced reinfection are excluded from this study, as they are not the primary focus of interest (n = 6360). For all patients remaining (n = 322303), we checked if they exhibited LC-19 symptoms at least 28 days after the initial infection date to determine which patients had LC-19 (n = 4360). According to LC-19 categorisation definitions, a patient is assessed as an acute post-COVID case if any LC-19 symptom has persisted for more than 28 days but less than 12 weeks after the COVID-19 infection date (n = 1058). They are considered a long post-COVID case if they exhibit any LC-19 symptoms persistence between 12 and 24 weeks after the infection (n = 590), and a persistent post-COVID case if LC-19 symptoms persist beyond 24 weeks from the infection (n = 2807). The mean follow-up time for LC-19 patients is 358 days, whereas for those no LC-19 patients, the mean follow-up time is 160 days.
Since this study is a retrospective cohort analysis, the availability of patient data depended on the completeness of electronic health records, rather than on predefined data collection. Our inclusion criteria required patients to have a confirmed positive COVID-19 test, along with documented information on demographics, symptoms, comorbidities, and vaccination status. From the initial dataset of 675,126 patients with confirmed COVID-19 diagnoses, we identified that 329,300 patients lacked all data on comorbidities (16 variables) and demographic information (e.g., age and sex). Given that these variables were critical for our analyses, patients without this information did not meet the inclusion criteria and were therefore excluded. This exclusion was not a standard procedure for handling missing data within an established study population,but rather a necessary step to ensure that all included patients had sufficient data for valid statistical comparisons aligned with the study’s objectives. Due to the large size of the dataset, the exclusion of these cases did not affect statistical power, but was essential to maintain the integrity and reliability of our analyses. The missing data pattern indicates that the lack of information was not missing at random or missing completely at random33, but rather a consequence of structural gaps in the health records where the covariates did not exist. Including these cases would have introduced significant bias due to the absence of essential covariate data.
Data description and preprocessing
The demographic information and comorbidities of all patients in the population study were obtained from a database used for stratification purporses during COVID-19 pandemic. Available characteristics include age, sex, number of chronic diseases, number of affected systems, and various medical conditions such as diabetes mellitus, heart failure, chronic obstructive pulmonary disease, arterial hypertension, depression, ischaemic cardiomyopathy, stroke, renal insufficiency, cirrhosis, osteoporosis, osteoarthritis, arthritis, obesity, and asthma. A total of 322,303 patients have been studied; however, symptomatology records are available for 297,737 patients who have sought care in primary healthcare settings. This data includes features such as lack of appetite, nasal congestion, rhinorrhoea, low grade fever, eye symptoms, expectorate, sore throat, stomach pain, vomit, nasal discharge, chills and malaise. To perform the analyses that are based on the vaccination database, only those patients who received a vaccination 21 days prior to a confirmed diagnosis of COVID-19 infection were included in the study. Additionally, we eliminated patients whose schedule was inconclusive, for example patients that had received several doses on the same day. This left us with vaccine schedule information for 320,141 patients. Other data, such as medication (30,311 patients) or length of stay in each hospital department (15,829 patients), were not included in the analysis as they were deemed to be outside the scope of the study and would have significantly reduced the number of patients included.
Analysis of sociodemographic factors, comorbidities and symptoms between LC-19 patients and non-Long COVID-19 patients
Following the classification of LC-19 patients proposed by Fernández-de-las-Peñas et al.9 we conducted an exploratory analysis of sociodemographic factors, comorbidities and symptoms to seek for differences between non-Long COVID-19 and LC-19 patients (Table 1 and 2). The main difference between non-Long COVID-19 and LC-19 patients regarding sociodemographic factors was sex (Female %: 52.5% v. 61.1 % respectively). Being female increased the likelihood of developing LC-19 (AOR [95% CI] = 1.39 [1.31, 1.48], adjusted p < 0.001). No differences in sex composition were observed between the subtypes of LC-19 patients. The age median was very similar for non-Long COVID-19 and those with the condition (38 v. 37, respectively). However, we observed age differences among the subtypes of LC-19 patients; acute post-COVID patients were older than both long post-COVID and persistent post-COVID patients (adjusted p < 0.001).
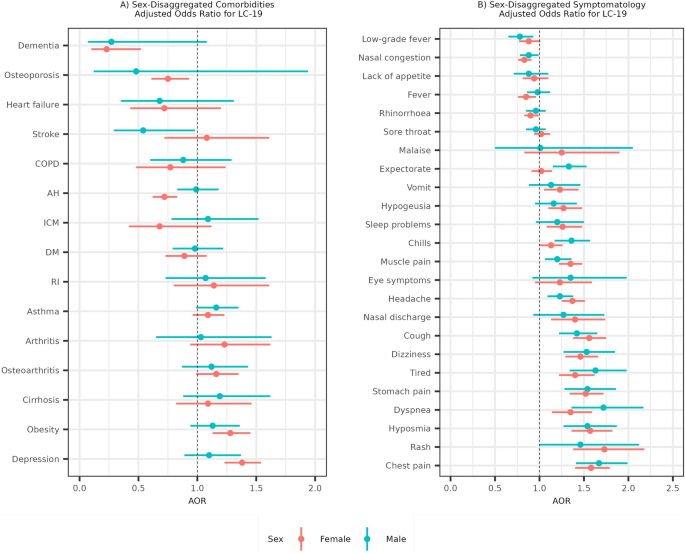
Considering sex as an important factor in the development of LC-19 prompted us to analyse comorbidities and symptoms, disaggregated by sex, as illustrated in Fig. 2. In female patients, obesity (AOR [95% CI] = 1.28 [1.13, 1.45]) and depression (AOR [95% CI] = 1.38 [1.23, 1.54]) were identified as comorbidities associated with a statistically significant increased risk for LC-19. Conversely, dementia (AOR [95% CI] = 0.23 [0.1, 0.52]), arterial hypertension (AOR [95% CI] = 0.72 [0.62, 0.83]) and osteoporosis (AOR [95% CI] = 0.75 [0.61, 0.93]) were associated with a reduced risk of LC-19 (Fig. 2A). In male patients, no comorbidities were found to be associated with an increased risk of LC-19, while only stroke (AOR [95% CI] = 0.54 [0.29,0.98]) was associated with a reduced risk of LC-19. We performed the same analysis disaggregated by LC-19 type of patient and no differences were observed (Supplementary Fig. 1). Additionally, crude ORs were obtained and are presented in the Supplementary Table 1.
(A) Adjusted odds ratios for developing LC-19 based on different comorbidities. (B) Adjusted odds ratios for developing LC-19 based on acute-phase COVID-19 symptoms. The female sex is coloured in red and the male sex in blue. Odds ratios are adjusted by age, the symptoms and the comorbidities. COPD is chronic obstructive pulmonary disease, AH is arterial hypertension, ICM is ischemic cardiomyopathy, DM is diabetes mellitus and RI is renal insufficiency.
Concerning differences in symptomatology, we noted a higher percentage of initial symptoms in LC-19 patients compared to non-Long COVID-19 patients (Table 2 and Supplementary Fig. 2). The five symptoms most significantly increasing the likelihood of LC-19 development were chest pain (AOR [95% CI] = 1.67 [1.41, 1.99] for males and AOR [95% CI] = 1.58 [1.40, 1.79]) for females), hyposmia (AOR [95% CI] = 1.54 [1.27, 1.87] for males and AOR [95% CI] = 1.57 [1.36, 1.82]) for females), and stomach pain (AOR [95% CI] = 1.54 [1.28, 1.86] for males and AOR [95% CI] = 1.52 [1.34, 1.72]) for females), followed by rash (AOR [95% CI] = 1.46 [1, 2.12] for males and AOR [95% CI] = 1.73 [1.38, 2.18]) for females), and dyspnea (AOR [95% CI] = 1.72 [1.36, 2.17] for males and AOR [95% CI] = 1.35 [1.14, 1.59]) for females) (Fig. 2B). Regarding symptom sex differences, no significant variations were observed in the likelihood of experiencing a particular symptom during the primary COVID-19 infection and subsequently developing LC-19. We conducted the same analysis, stratified by LC-19 patient type, and found that for most symptoms, there were no significant differences among LC-19 patient subtypes (Supplementary Fig. 3). However, hyposmia showed a markedly stronger association with persistent LC-19 patients (AOR [95% CI] = 1.92 [1.66, 2.22], adjusted p < 0.005) than with acute post-COVID (AOR [95% CI] = 1.16 [0.93, 1.46], adjusted p > 0.05) or long post-COVID patients (AOR [95% CI] = 1.03 [0.72, 1.45], adjusted p > 0.05). Similarly, the association of chest pain was notably more pronounced in acute post-COVID patients (AOR [95% CI] = 2.08 [1.77, 2.46], adjusted p < 0.001) compared to those with persistent LC-19 (AOR [95% CI] = 1.42 [1.24, 1.62], adjusted p < 0.001) and long post-COVID (AOR [95% CI] = 1.28 [0.94, 1.75], adjusted p > 0.05). Crude ORs for symptoms were also obtained and are presented in the Supplementary Table 2.
Impact of COVID-19 hospitalisation on the development of LC-19
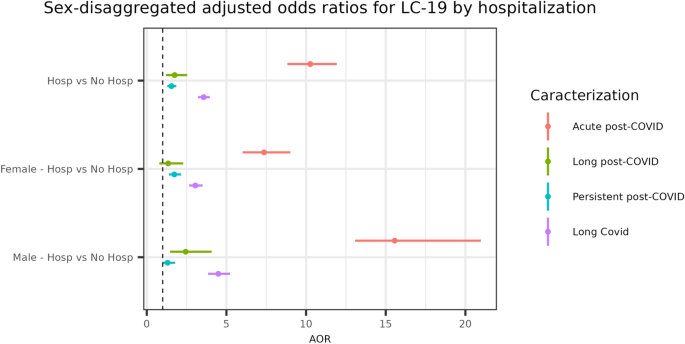
To understand the implications of COVID-19, the need of hospitalisation serve as a crucial indicator, shedding light on the disease’s progression and severity across diverse patient profiles. This analysis focuses on the AORs for developing LC-19 among hospitalised and non-hospitalised patients, paying close attention to the interplay between sex and disease severity. We particularly differentiate among various LC-19 patient classifications through their impact on health outcomes. Illustrated in Fig. 3, our analysis offers a clear depiction of the odds associated with LC-19. Notably, hospitalised patients in the LC-19 category exhibit an AOR [95% CI] = 3.57 [3.22, 3.95], with an adjusted p < 0.001, adjusted by age and sex. Upon disaggregation by sex, an AOR [95% CI] = 4.49 [3.85, 5.23], with an adjusted p < 0.001, was observed for males and an AOR [95% CI] = 3.05 [2.66, 3.51], with an adjusted p < 0.001, was noted for females, suggesting a significantly higher likelihood of developing LC-19 overall compared to non-hospitalised counterparts. Specifically, acute post-COVID conditions present a markedly increased risk for hospitalised patients (AOR [95% CI] = 10.26 [8.83, 11.92], adjusted p < 0.001), especially for males (AOR [95% CI] = 15.56 [13.08, 20.97], adjusted p < 0.001) compared to females (AOR [95% CI] = 7.36 [6.02, 9.01], adjusted p < 0.001). Similarly, for persistent post-COVID conditions, a statistically significant higher risk is observed for hospitalised patients of both sex (AOR [95% CI] = 1.55 [1.29, 1.85], adjusted p < 0.001). For Long post-COVID conditions, hospitalised patients face a considerable risk (AOR [95% CI] = 1.75 [1.21, 2.53], adjusted p < 0.005), with this increased risk being significant solely for male patients (AOR [95% CI] = 2.44 [1.46, 4.07], adjusted p < 0.001). This suggests that hospitalisation is not only a high-risk factor for developing long post-COVID and persistent post-COVID manifestations of LC-19 classifications but is particularly crucial for acute post-COVID patients. The AOR for acute post-COVID patients is significantly higher than for other LC-19 classifications. In order to demonstrate the inherent risk associated with hospitalisation, crude ORs are presented in the Supplementary Table 3.
Effects of vaccination on LC-19
We examined the effects of COVID-19 vaccination, including the impact of dosage, patterns, and brand differences on the course of LC-19. Supplementary Fig. 4 shows the vaccine administration flow in the cohort under study. Only 15.95% of the cohort is unvaccinated. The most commonly used vaccine brands, in our data, for the first administration are Pfizer (72.39%) and Moderna (15%), followed by Astra Zeneca (8.22%) and Janssen (4.39%). The initial dominance of Pfizer decreases over time. This is shown by the transition from first to second doses. Pfizer still leads, but with a reduced majority of 67.07% of the second dose administration, and it is followed by Moderna (24.25%), Astra Zeneca (8.68%) and Janssen (< 0.01%). Meanwhile, 33.6% of the cohort did not receive a second dose. Furthermore, 80.46% of the population has not yet received a third dose. Among the available brands, Moderna has administered the highest proportion of third doses at 80.20%, followed by Pfizer at 19.79% and Astra Zeneca (0.01%). No Janssen doses were recorded during the administration of the third dose.
When evaluating the protective effect of vaccination in relation to the health impact of COVID-19, the results are significantly influenced by vaccination status. Table 3 demonstrates a clear protective effect of vaccination vs no vaccine against LC-19, after adjusting by age and sex the AOR [95% CI] = 0.10 [0.09, 0.12], and adjusted p < 0.001. The analysis of vaccine doses and their impact on LC-19 incidence reveals a notable more pronounced protective effect when comparing two doses against one dose (AOR [95% CI] = 0.38 [0.29, 0.50], adjusted p < 0.001) and even three doses against both two doses (AOR [95% CI] = 0.39 [0.27, 0.58], adjusted p < 0.001) and one dose (AOR [95% CI] = 0.11 [0.06, 0.18], adjusted p < 0.001). We also observed that mRNA vaccines provided a more protective effect against LC-19 than viral vector-based vaccines (AOR [95% CI] = 0.48 [0.37, 0.63], adjusted p < 0.001). We performed the analysis of mRNA vaccines vs viral vector-based vaccines disaggregated by sex and found this effect to be statistically significant only in women (Supplementary Fig. 5). Considering the effect of mRNA vaccines, we studied a combination of mRNA and viral vector-based vaccines, comparing them against two doses of either mRNA or viral vector-based vaccines alone. A mix of mRNA and viral vector-based vaccines in any order was more protective than two doses of viral vector-based vaccines (AOR [95% CI] = 0.3 [0.15, 0.58], adjusted p < 0.001) and as protective as two doses of mRNA vaccines against LC-19 (AOR [95% CI] = 0.77 [0.41, 1.46], adjusted p = 0.43). Additionally, in order to observe the inherent risk associated with each condition mentioned before, crude ORs are available in the Supplementary Table 4.
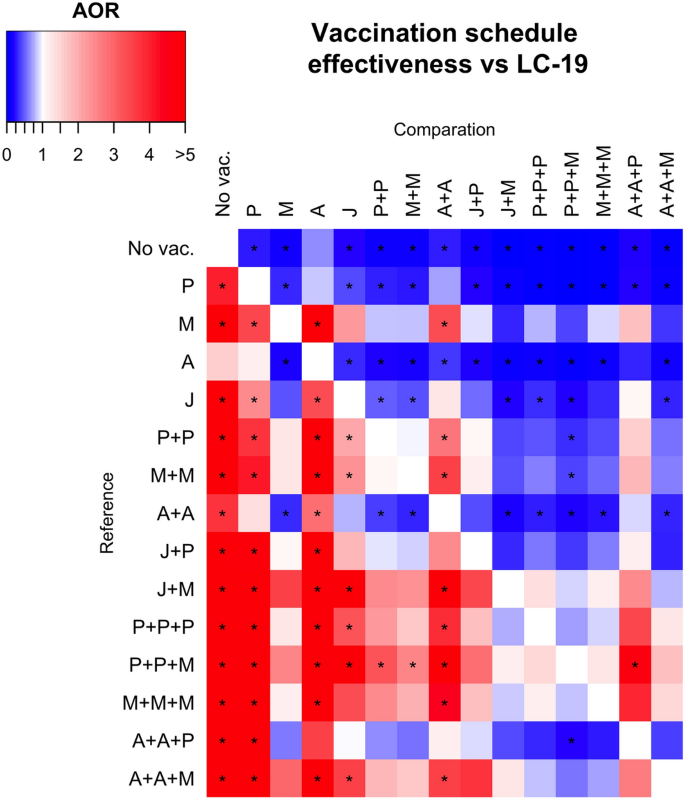
Adjusted odds ratios (AORs) for various vaccination schedules against LC-19. Vaccination schedules are represented by combinations of letters that reflect the order in which the vaccines were administered to participants. With A for AstraZeneca, P for Pfizer, M for Moderna, and J for Janssen vaccines. Blue squares represent greater protective behavior indicated by lower adjusted odds ratios (AOR), when comparing the reference schedules (rows) with the comparison ones (columns), being then the comparison one more protective. In contrast, red squares signify a higher AOR, indicating less protective effect against the outcome. If the adjusted p-value for the AOR is less than 0.05, the comparison is flagged with a star (*).
Furthermore, we investigated the effects of various COVID-19 vaccination schedules, segmented by vaccine brand, on LC-19 incidence (Fig. 4). AORs were utilised to determine the relative protection offered by specific vaccination schedules. Figure 4 summarises the protective effects of different vaccination schedules against LC-19. Initially, it was found that any vaccination schedule provides more protection against the development of LC-19 compared to being unvaccinated. The three most protective schedules were Pfizer + Pfizer + Moderna, Pfizer + Pfizer + Pfizer and Janssen + Moderna. Conversely, the least protective vaccine schedules against LC-19 were a single dose of AstraZeneca (no statistically significant protection against LC-19 comparing with no vaccine administration), a single dose of Pfizer, and two doses of AstraZeneca. Exact values of AORs for each analysis is presented in Supplementary Table 5 and, in order to observe the inherent risk of each vaccine schedule comparison, all crude ORs are also available in Supplementary Table 6.
LC-19 calculator tool
A predictive model was developed to predict the probability of suffering from LC-19, depending on predictors like comorbidities, sex, age, the vaccination schedule up to 21 days before the positive diagnosis of COVID-19, and the symptomatology of the individual at the initial diagnosis of the COVID-19 infection and up to 28 days after the positive test for COVID-19. Only data collected prior to the LC-19 diagnosis were considered for training the model. Only patients with all the above information available were considered for this objective. The training dataset (199527 no LC-19 patients and 3031 LC-19 patients) was used to train the model and the test dataset (85511 no LC-19 patients and 1298 LC-19 patients) was used to evaluate the model.
IPIP and Smote were used to deal with the imbalanced proportion of LC-19 and no LC-19 patients together with logistic regressions as ML algorithms. IPIP with logistic regression obtained a balanced accuracy of 73% and ROC-AUC of 0.80 (Supplementary Fig. 6) on the test dataset and for Smote with logistic regression we obtained a balanced accuracy of 65% and a ROC-AUC of 0.79. Then, we used IPIP with logistic regression models to create an online LC-19 calculator that is accessible at (LC-19 Calculator).
In order to utilise the calculator to get a probability of suffering LC-19, it is necessary to input the patient’s sex, age, comorbidities, and symptomatology during the acute-phase of COVID-19, as well as their vaccination schedule prior to 21 days of infection.


