Search results
A total of 14,077 studies were identified through Google Scholar (n = 9,741), PubMed (n = 573), ScienceDirect (n = 2,854), and Scopus (n = 909). After removing duplicates, a total of 11,287 studies were considered. Subsequently, studies were excluded for the following reasons: irrelevant topic (n = 10,271), not published in English (n = 588), and those that could not be retrieved or lacked full text (n = 74). The remaining 354 articles were screened, and finally 14 articles were selected for quantitative analysis (Fig. 1).

A PRISMA flowchart outlining the study selection process and literature search. Multiple databases were systematically reviewed using predefined search strategies to identify eligible studies focusing on prevalence and resistance of A. hydrophila.
Study characteristics
A total of 14 published articles involving 2,094 samples were included (Table 1). The sample sizes of the primary studies varied, ranging from 71 to 500 samples. The characteristics of eligible studies are summarized. Most of the studies were indexed in Google Scholar (n = 8), followed by PubMed (n = 4) and Scopus (n = 2). Most of the studies originated from Asia (n = 8) and Africa (n = 6). All studies used cross-sectional research designs. The samples in the primary studies were collected from various fish species (e.g., catfish, carp, tilapia, tuna, milkfish, mugil cephalus, and mugil fish) and shrimp (e.g., riceland prawn). Probability sampling techniques were employed to select a representative sample. Most specimens were internal organs (n = 9), followed by gills (n = 5), and carcass rinse samples (n = 4), although studies included different sample types. Additionally, two studies contained water samples for the analysis.
The assessment of the prevalence of A. hydrophila was conducted across different years in 2020 (n = 1), 2021 (n = 4), 2022 (n = 6), and 2023 (n = 3), respectively (Table 2). The data only were retrieved from Africa (Egypt-6) and Asia (Thaialnd-3, Indonesia-1, Malysia-1, Iran-1, India-1, and Vietnam-1). The number of samples varied from 71 to 828, with positive isolates ranging from 17 to 187. Different protocols have been used for the bacterial isolation of A. hydrophila, including methods from the U.S. Food and Drug Administration Bacteriological Analytical Manual (U.S. FDA BAM), Public Health England (PHE), and Bergey’s Manual of Systematic Bacteriology. Aeromonas selective media, Rimler-Shotts (RS) and TSA, were commonly used, with or without antimicrobials such as ampicillin and novobiocin. For the confirmation of A. hydrophila, biochemical identification tests were employed, including Aerokey II, API 20E, and various assays for arginine decarboxylase, β-galactosidase, bile esculin, catalase, citrate, cyanide, gelatinase, Gram staining, growth in 0% and 6.5% NaCl, hydrolysis, hydrogen sulfide, indole, lipase, lysine decarboxylase, mannitol, methyl red-Voges-Proskauer (MR-VP), motility, ornithine decarboxylase, oxidase, pigment formation, potassium, protease, sugar fermentation, sulfide, triple sugar iron (TSI), and urease tests.
Additionally, molecular techniques using PCR with specific genes (e.g., act; aeroH; aer; aerA) and 16 S rRNA were conducted for identification of A. hydrophila. For AST, most studies used the disk diffusion method (n = 13) and agar dilution (n = 1), along with standard methods such as those from the National Committee for Clinical Laboratory Standards (NCCLS), European Committee on Antimicrobial Susceptibility Testing (EUCAST), and Clinical and Laboratory Standards Institute (CLSI 2012, 2014–2016, M45, and M100). The control strains used in AST were identified as A. hydrophila (ATCC 7966) (n = 3), Escherichia coli (ATCC 25922) (n = 1), and a combination of Staphylococcus aureus (ATCC 29213), E. coli (ATCC 25922), and Pseudomonas aeruginosa (ATCC 27853) (n = 1). In contrast, most publications (n = 9) did not mention the use of a control strain.
Pooled prevalence of A. hydrophila stratified by geographical distribution
The prevalence of A. hydrophila was 30.7% with a 95% C.I. of 17.0-46.3% across 14 studies (Fig. 2). The subgroup by continent revealed a higher prevalence in Africa (36.0%; 95% C.I. = 18.6–55.5%, I2 = 97.21) compared to Asia (26.9%; 95% C.I. = 8.5–50.7%, I2 = 99.0) (Fig. 2a). A funnel plot for assessing publication bias presented fewer outliers (Fig. 2b).
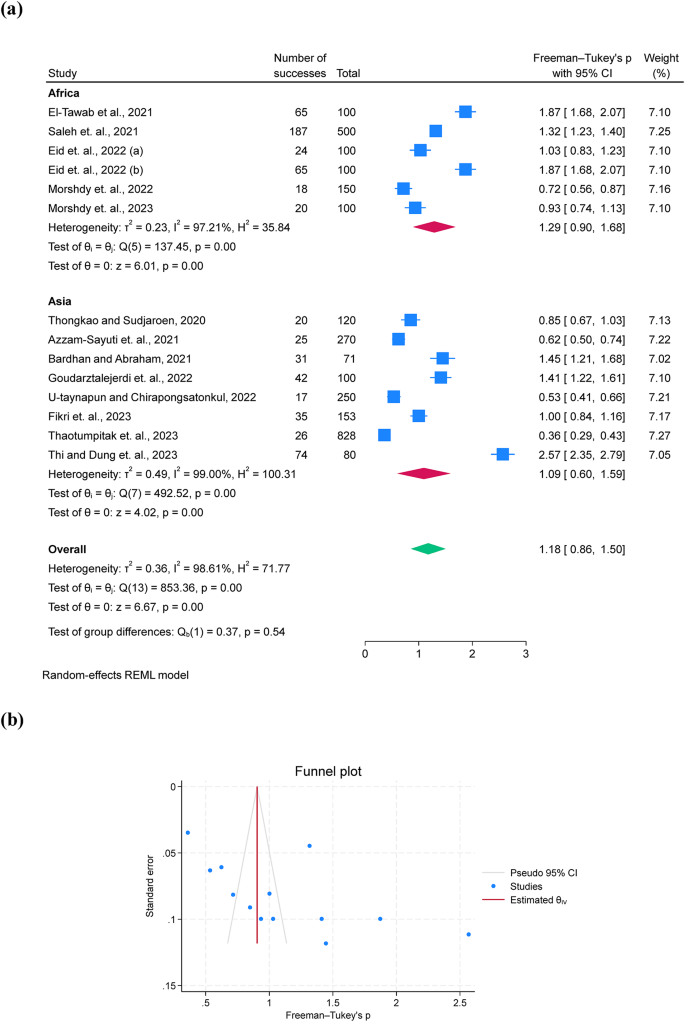
A forest plot comparing the prevalence differences of A. hydrophila between Africa and Asia (a) and a funnel plot for assessing publication bias (b).
Pooled prevalence of A. hydrophila resistance
Twelve studies were included for the examination of AMR phenotypes, while two studies were excluded due to unclear reporting and low number of isolates (n = 4) used for AST17,28. AST was performed using 12 antimicrobial classes, including aminoglycosides, carbapenems, cephalosporins, chloramphenicol, penicillins, quinolones, lacosamide, nitrofuran, polymyxins, sulfonamides and tetracyclines. A. hydrophila showed the highest prevalence of resistance to penicillin (80.7%; 95% C.I. = 67.2–91.5%), oxytetracycline (69.9%; 95% C.I. = 38.5–94.0%), and macrolides (67.8%; 95% C.I. = 17.6–100%) and resistance was more frequently observed in Africa than in Asia (Fig. 3a, b, and c). Additionally, funnel plots were presented without outliers for the pooled prevalence of penicillin resistance, while one outlier was identified in oxytetracycline (Fig. 3d).


A forest plot comparing the differences in A. hydrophila resistance to penicillin (a) and oxytetracycline (b) between Africa and Asia, a funnel plot for assessing publication bias of the studies penicillin (c), oxytetracycline (d).
The highest prevalence of aminoglycoside resistance was found for streptomycin (39.0%; 95% C.I. = 13.2–68.3%), followed by amikacin (22.7%; 95% C.I. = 5.5–45.9%) and gentamicin (19.2%; 95% C.I. = 7.8–33.6%), while resistance to kanamycin and neomycin was reported in fewer studies (Tables 3 and 4). The pooled prevalence of various antimicrobial classes was as follows: penicillin (80.7%; 95% C.I. = 67.2–91.5%), macrolides (67.8%; 95% C.I. = 17.6–100%), carbapenems (44.0%; 95% C.I. = 4.7–88.5%), chloramphenicol (30.2%; 95% C.I. = 12.4–51.6%), cephalosporins (24.0%; 95% C.I. = 10.3–40.9%), and quinolones (16.8%; 95% C.I. = 5.9–21.2%). Additionally, one study observed the absence of Extended-Spectrum β-Lactamases (ESBL) production in A. hydrophila29. For sulfonamides, resistance was relatively high for sulfamethoxazole (57.5%; 95% C.I. = 22.7–88.7%) and trimethoprim (28.2%; 95% C.I. = 9.2–52.1%). In tetracyclines, resistance was relatively high for oxytetracycline (69.9%; 95% C.I. = 38.5–94.0%) and tetracycline (60.7%; 95% C.I. = 35.2–83.5%). Clindamycin, kanamycin, co-trimoxazole, doxycycline, nitrofurantoin, and colistin were each reported in only a single study. Additionally, the multiple antibiotic resistance (MAR) index, a ratio calculated by dividing the number of antibiotics an isolate is resistant to by the total number of antibiotics tested, The MAR index was found in 6 out of 12 studies (50%), with values ranging from 0.2 to 1.0.
MDR were mentioned in two studies from Thailand (n = 4/15) and Egypt (n = 11/14).
Prevalence of genotypic resistance and virulence genes of A. hydrophila
Only five studies assessed the pooled prevalence of virulence genes (act; aer; aerA and ahyB), with a pooled prevalence of 71.2% (95% C.I. = 57.4–83.4%). Additionally, resistance genes were limitedly assessed, with blaTEM showing a prevalence of 67.0% (95% C.I. = 13.6–100%), followed by tetA 63.7% (95% C.I. = 19.0-94.8%) (Table 3; Fig. 4a and b). Additionally, funnel plots were presented without outliers for the pooled prevalence of blaTEM and tetA (Fig. 4c and d).


A forest plot comparing the differences in A. hydrophila resistance to blaTEM (a) and tetA (b) between Africa and Asia, a funnel plot for assessing publication bias of the studies blaTEM (c) and tetA (d).
Some AMR genotypes were infrequently observed in limited studies. Specific AMR genotypes observed include aminoglycosides (addA1; 5/5), trimethoprims (dfrA1: 3/3), colistin (mcr-3; 3/15), florfenicol (floR: 2/15), quinolones (qnrS: 2/15), sulfonamides (sul2: 2/15 and 10/42), and tetracyclines (tetB: 2/10; tetC: 5/10)27. Additional genes detected in a study by Thoathumpitak included addA2, aac(3)IV, aac(6’)-Ib, blaSHV, blaCTX−M, blaNDM, blaPSE, blaOXA, catA, catB, cmlA, ermB, qepA, strA, strB, sul3, tetB, qnrB, dfrA12, mcr2-5, int3, and intSXT, which were absent29. Integron (int1) was observed in only three studies: 0/15, 4/4, and 3/3, while integron (int2) was present in one study with a positive result of 2/42.
Publication bias
As indicated by the funnel plot of the estimated prevalence of A. hydrophila, asymmetry was observed, suggesting potential publication bias (Smaller studies with positive outcomes seem to be published more frequently, as reflected in the upper left of the plot. To confirm this, an Egger’s test was performed to assess the statistical significance of the funnel plot’s asymmetry (Table 5). The Egger’s test revealed a significant small-study effect (p = 0.003), confirming the presence of publication bias. Similarly, publication bias was also observed in the prevalence of AMR to penicillin, blaTEM, and tetA (Table 5). However, no publication bias was detected in the pooled prevalence of oxytetracycline.
Quality assessment
The quality assessment revealed that 14 publications included in this study exhibited a low to moderate risk of bias. This suggests that the studies were generally of acceptable quality, with minimal concerns about systematic errors or biases that could affect the reliability of the results.


