Demographic and clinical characteristics of the study participants
Individuals admitted with COVID-19 to TGH were managed by a multidisciplinary team comprised of hospitalists, pulmonary/critical care specialists, infectious disease specialists, nursing, respiratory therapy, pharmacy, and case management. Thus, all patients with severe COVID-19 were managed with internally consistent approaches that evolved as additional guidelines and treatments became available. The period of this study overlapped with the original, alpha, and delta waves of infection in the Tampa Bay region.
Table 1 presents participants’ basic demographics. The 113 subjects evaluated in this study had an average age of 60.6 years, with a standard deviation of 17.0. Of these, 53.9% (61) were male, 35.4% (40) Hispanic, 34.5% (39) Caucasian, and 23.9% (27) Black. 7.1% were current smokers, 25.7% former smokers, and 67.3% non-smokers (8, 29, and 76 patients, respectively). The mean BMI was 29.5 with a standard deviation of 8.1. 21.2% required ventilator management (24) and the overall mortality rate was 19.5% (22).
Among the individuals included in the study, 34.5% (39) had type I or II diabetes mellitus, 19.4% (22) coronary artery disease, 21.2% (24 ) hyperlipidemia, 52.2% (59) hypertension, 14.1% (16 ) chronic kidney disease, 10.6% (12 ) had undergone organ transplantation of any kind, 6.1% (7) Chronic Obstructive Pulmonary Disease (COPD), 2.7% (3) cirrhosis, 10.6% (12 ) cancer, 2.7% (3 ) dementia, and 35.4% (40) obesity, as defined by a body mass index greater than 30.
Correlation coefficient between LogPAI-1 and age, LogPAI-1 and BMI
Figure 1a shows the correlation between logPAI-1 levels and age, and Fig. 1b the correlation between logPAI-1 levels and BMI, as determined using simple linear regression analysis. Age was positively correlated with logPAI-1 (r = 0.286, p < 0.002).

Correlation between PAI-1 levels and age/BMI. (a) shows the scatter plot and linear regression analysis of logPAI-1 with age. (b) shows the scatter plot and linear regression analysis of logPAI-1 with BMI.
In contrast, no significant correlation was found between logPAI-1 and BMI.
PAI-1 levels across different categories
Table 2 shows the median and interquartile range (IQR) of the PAI-1 levels in various categories, including sex, smoking status, and comorbidities. Notably, PAI-1 levels were higher in patients who required ventilator assistance, those who died, and those with hyperlipidemia.
Analysis of mortality rates and the need for mechanical ventilation by sex, smoking status, and comorbidities
Table 3 displays the rates and odds ratios for death or the need for mechanical ventilation among patients classified according to sex, smoking status, and presence or absence of specific comorbidities.
The mortality rate of individuals with coronary artery disease was 36.4%, and the odds ratio (OR) for death was 3.14 (95% CI, 1.11 to 8.88). Furthermore, the mortality rate of patients with COPD was 57.1%, with an OR for death of 6.52 (95% CI, 1.34 to 31.66). Regarding the other previously described risk factors, there were no differences in mortality rates and ORs for death in this sample. Additionally, there were no differences in the proportion of patients and the OR for requiring mechanical ventilation in all categories and comorbidities (data not shown).
Levels of PAI-1 associated with worse outcomes after adjusted for age, sex, BMI, and comorbidities
Multivariate logistic regression analysis was conducted to examine the relationship between logPAI-1 levels and patient outcomes and the results are presented in Table 4.
Model 1 was developed to consider age, gender, and body mass index (BMI). Model 1 demonstrated a relationship between logPAI-1 levels and the requirement for mechanical ventilation support (OR 3.02, 95% CI 1.28 to 7.98) and mortality (OR 2.78, 95% CI 1.18 to 7.32). Model 2 was adjusted for the variables in Model 1 as well as for respiratory diseases. Model 2 showed that logPAI-1 levels were associated with the need for mechanical ventilation support (OR 3.12, 95% CI 1.28 to 8.43) and death (OR 2.89, 95% CI 1.19 to 7.93). Model 3 was adjusted for the variables in Model 2 as well as for cardiovascular disease. Model 3 revealed that logPAI-1 levels were associated with the need for mechanical ventilation support (OR 3.12, 95% CI 1.28 to 8.45) and death (OR 2.94, 95% CI 1.20 to 8.29). Model 4 was adjusted for the variables in Model 3 and for diabetes. Model 4 showed that logPAI-1 levels were associated with the need for mechanical ventilation support (OR 3.35, 95% CI 1.37 to 9.13) and death (OR 3.13, 95% CI 1.27 to 8.91). Model 5 was adjusted for the variables in Model 4 and hyperlipidemia. Model 5 indicated that logPAI-1 levels were associated with the need for mechanical ventilation (OR 3.42, 95% CI 1.40 to 9.32) and death (OR 3.16, 95% CI 1.28 to 9.05). After accounting for age, sex, BMI, and comorbidities, logPAI-1 levels remained independently associated with critical illness.
Predictive value of logPAI-1 levels for outcomes for patients with comorbidities
Univariate logistic regression analysis of the associations between logPAI-1 levels and outcomes in patients with and without comorbidities is shown in Fig. 2. Univariate analysis revealed that 1 unit of logPAI-1 increase yielded ORs for requiring mechanical ventilation support of 3.7 (95% CI, 1.3 to 12.5) without obesity, 3.4 (95% CI, 1.2 to 11.9) with cardiovascular disease (including both hypertension and coronary artery disease), 4.1 (95% CI, 1.5 to 13.4) without diabetes, and 2.8 (95% CI, 1.2 to 7.5) without hyperlipidemia. There was a significant correlation between logPAI-1 levels and mechanical ventilation support requirements in patients with cardiovascular disease, and without obesity, diabetes, and hyperlipidemia.
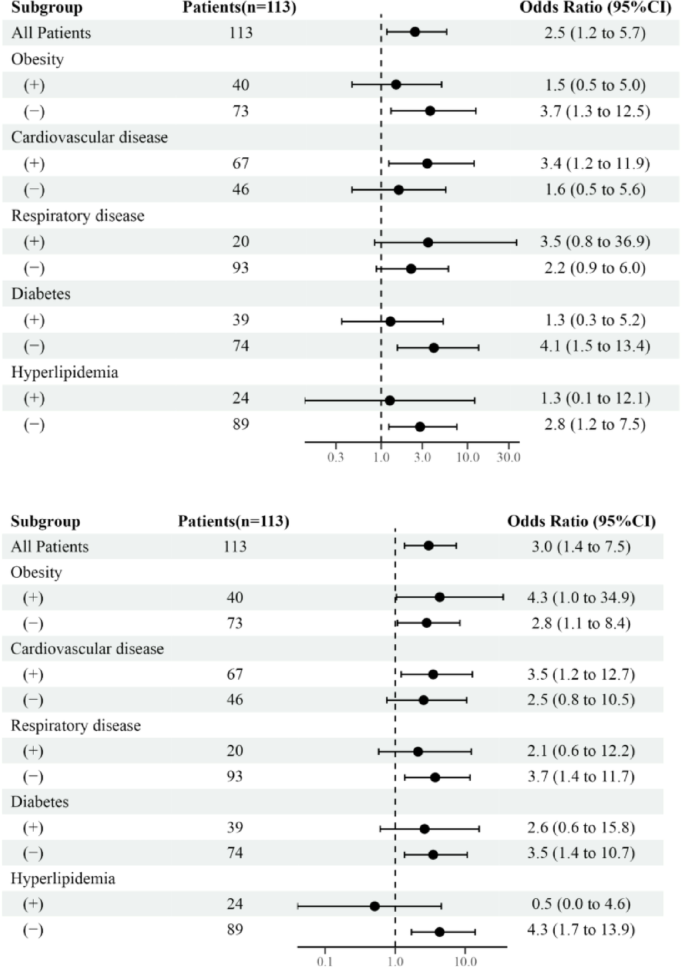
A forest plot depicting the relationship between logPAI-1 levels and outcomes in patients with and without comorbidities. (a) shows Odd Ratio (ORs) for requiring mechanical ventilation support in patients with and without comorbidities. (b) shows ORs for death in patients with and without comorbidities.
Also, 1 unit of logPAI-1 increase yielded ORs for death of 4.3 (95% CI, 1.04 to 34.9) in patients with obesity, 2.8 (95% CI, 1.1 to 8.4) without obesity, 3.5 (95% CI, 1.2 to 12.7) with cardiovascular disease, 3.7 (95% CI, 1.4 to 11.7) without respiratory disease, 3.5 (95% CI, 1.4 to 10.7) without diabetes, and 4.3 (95% CI, 1.7 to 13.9) without hyperlipidemia. The relationship between logPAI-1 levels and mortality was evident in patients, irrespective of obesity status, and in those with cardiovascular disease, and those without, respiratory disease, diabetes, and hyperlipidemia.


