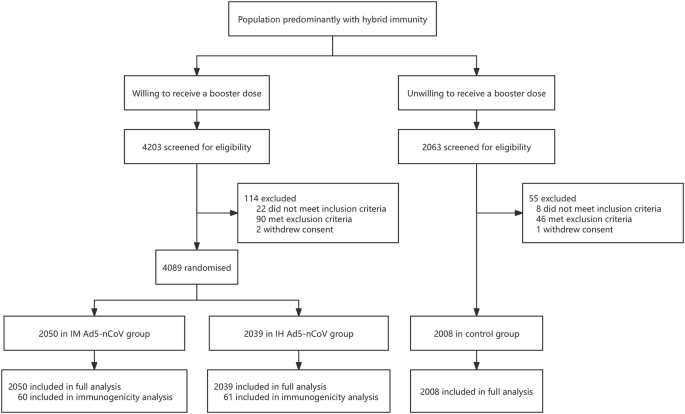
Trial profile
Between May 23, 2023, and August 28, 2023, a total of 4089 eligible participants were equally randomized to receive a booster dose of aerosolized Ad5-nCoV via oral inhalation at 0.1 mL (IH Ad5-nCoV, n = 2039) or intramuscular injection of Ad5-nCoV at 0.5 mL (IM Ad5-nCoV, n = 2050). Additionally, 2008 participants who declined the booster vaccination but consented to participate in COVID-19 surveillance were enrolled as the control group. The final database was locked on March 05, 2024, after a 6-month follow-up period for participants in both the boosting groups and the control group. A total of 6097 participants were included in the final analysis (Fig. 1).
IM Ad5-nCoV adenovirus type 5 vectored COVID-19 vaccine through intramuscular injection, IH Ad5-nCoV adenovirus type 5 vectored COVID-19 vaccine through oral inhalation.
The median follow-up time for both vaccine groups and the control group was 168.0 days (IQR 168.0–180.0). The mean age of all participants was 53.1 years (SD 17.5; range 18–96), with 2902 (47.6%) individuals aged 18–54 years, and 3195 (52.4%) aged 55 years or older (Table 1). The demographic information for the two age groups is detailed in Table S1. Among the 6097 participants, 2821 (46.3%) were male, 1569 (25.7%) reported coexisting conditions and 4555 (74.7%) reported previous SARS-CoV-2 infection history at enrollment. Baseline characteristics were largely similar between the IH Ad5-nCoV and IM Ad5-nCoV groups, but differences were observed between both vaccine groups and the control group (p < 0.05). Specifically, participants in the control group were younger, with a higher proportion of female and SARS-CoV-2 infection history, a higher body mass index (BMI), and a lower proportion of coexisting conditions. In the immunogenicity subgroup, demographic characteristics were well-balanced between the IH Ad5-nCoV and IM Ad5-nCoV groups (Table S2).
Effectiveness analysis
During the surveillance period, a total of 79 COVID-19 cases were confirmed, with 22 (23/1000 person-years) in the IH Ad5-nCoV group, 23 (24/1000 person-years) in the IM Ad5-nCoV group, and 34 (37/1000 person-years) in the control group. However, 5 COVID-19 cases (4 in the IH Ad5-nCoV group and 1 in the IM Ad5-nCoV group) were confirmed within 7 days post-vaccination and excluded from the analysis of the primary and secondary endpoints. As shown in Fig. 2, starting from 28 days post-vaccination, the cumulative COVID-19 incidence of both vaccine groups gradually showed differences compared to the control group.

Lines represent point estimates. + Represents participants who were censored. The shading represents the 95% confidence interval. IM Ad5-nCoV adenovirus type 5 vectored COVID-19 vaccine through intramuscular injection, IH Ad5-nCoV adenovirus type 5 vectored COVID-19 vaccine through oral inhalation.
In the full analysis population, from 14 days after the vaccination, 14 (15/1000 person-years) COVID-19 cases were confirmed in the IH Ad5-nCoV group, 19 (20/1000 person-years) cases were confirmed in the IM Ad5-nCoV group, and 34 (37/1000 person-years) cases were confirmed in the control group, which resulted in adjusted effectiveness of 52.3% (95% CI 10.4–74.6) for IH Ad5-nCoV and 37.2% for IM Ad5-nCoV (95% CI −11.2 to 64.5; Table 2). From 7 days after the vaccination, the adjusted effectiveness of IH Ad5-nCoV and IM Ad5-nCoV was 39.9% (95% CI −7.4 to 66.3) and 28.9% (95% CI −22.8 to 58.8), respectively. All COVID-19 cases confirmed during the surveillance period were symptomatic but mild, thus rendering an assessment of vaccine effectiveness against severe COVID-19 infeasible. Among the 18 successfully sequenced nucleic acid samples derived from COVID-19 endpoint cases, all were typed as Omicron variants, of which 9 (50.0%) were HK.3, 4 (22.2%) were EG.5.1.1, 3 (16.7%) were FY.3.1, 1 (5.6%) was FY.3, and 1 (5.6%) was GF.1.
The adjusted effectiveness of both vaccines in participants aged ≥55 years was numerically lower than that observed in those aged 18–54 years from 14 days after the vaccination, which was 34.5% [95% CI −116.3 to 80.2] vs. 60.2% [95% CI 14.8–81.4] in IH Ad5-nCoV group, and 10.8% [95% CI −166.9 to 70.2] vs. 45.9% [95% CI −7.5 to 72.8] in IM Ad5-nCoV group. Besides, numerically lower adjusted effectiveness of both vaccine groups was observed in participants with coexisting conditions compared to those without (IH Ad5-nCoV: 47.5% [95% CI −123.3 to 87.7] vs. 54.7% [95% CI 8.4–77.6]; IM Ad5-nCoV: 33.7 [95% CI −150.0 to 82.4] vs. 41.0% [95% CI −11.6 to 68.8]). Similarly, numerically lower adjusted effectiveness was found in those without SARS-CoV-2 infection history compared to those with (IH Ad5-nCoV: 50.6% [95% CI −199.6 to 91.9] vs. 52.4% [95% CI 6.8–75.6]; IM Ad5-nCoV: 5.0% [95% CI −328.2 to 78.9] vs. 40.3% [95% CI −11.2 to 67.9]; Table 2, Fig. S2).
Immunogenicity analysis
All participants in the immunogenicity subgroup (n = 121) donated blood samples at days 0 and 14, 118 (97.5%) and 115 (95.0%) of them donated blood samples at months 3 and 6, respectively. At baseline, 65.0% of participants in the IM Ad5-nCoV group and 75.4% of participants in the IH Ad5-nCoV group exhibited an inhibition of ≥50% against wild-type SARS-CoV-2. Furthermore, 40.0–45.0% of participants in the IM Ad5-nCoV group and 50.8–59.0% of participants in the IH Ad5-nCoV group demonstrated inhibition of ≥50% against BA.4, BA.5, and BF.7 variants. However, only 25.0% of participants in the IM Ad5-nCoV group and 36.1% of participants in the IH Ad5-nCoV group showed inhibition of ≥50% against the XBB.1 variant (Fig. 3). 14 days after the booster dose, both vaccines elicited even higher ACE2-RBD binding inhibition against wild-type SARS-CoV-2. Specifically, 95.0% of participants in the IM Ad5-nCoV group and 88.5% of participants in the IH Ad5-nCoV group achieved an inhibition of ≥50%. 6 months post- booster, the proportion of ACE2-RBD binding inhibition ≥50% in the IM Ad5-nCoV group declined significantly to 64.9%, whereas it remained high at 86.2% in the IH Ad5-nCoV group. Regarding the XBB.1 variant, the proportion of ACE2-RBD binding inhibition ≥50% peaked at 14 days in the IM Ad5-nCoV group, with 63.3% of participants achieving this level. In contrast, for the IH Ad5-nCoV group, the peak of ACE2-RBD binding inhibition ≥50% was observed at 3 months post-booster, with 70.0% of participants meeting the criterion. Furthermore, the stratified results based on SARS-CoV-2 infection history indicated that compared to participants with a history of infection, those without SARS-CoV-2 infection history had numerically lower baseline ACE2-RBD binding inhibition against wild-type SARS-CoV-2, BA.5 and XBB.1 variants but exhibited a greater increase 14 days after booster in both vaccine groups (Fig. S5).

ACE2-RBD binding inhibition (%) against spikes of wild-type SARS-CoV-2 (a), BA.1 variant (b), XBB.1 variant (c), BA.2.75 variant (d), BA.2.75.2 variant (e), BA.5 variant (f), BA.4.6 variant (g), BF.7 variant (h), BQ.1 variant (i), and BQ.1.1 variant (j). Lines indicate the median and error bars are interquartile ranges. The horizontal dashed line is the 50% inhibition. IM Ad5-nCoV: day 0 (n = 60), day 14 (n = 60), month 3 (n = 58), month 6 (n = 57); IH Ad5-nCoV: day 0 (n = 61), day 14 (n = 61), month 3 (n = 60), month 6 (n = 58). No technical replicates. The p values are the results of comparison between different time points using two-sided generalized estimating equations (day 0 versus day 14 and month 3 versus month 6). The p values for multiple comparisons have been adjusted. IM Ad5-nCoV adenovirus type 5 vectored COVID-19 vaccine through intramuscular injection, IH Ad5-nCoV adenovirus type 5 vectored COVID-19 vaccine through oral inhalation.
Pseudovirus neutralization results revealed that both vaccine groups exhibited relatively high geometric mean titers (GMTs) of antibody at baseline against wild-type SARS-CoV-2 (IH Ad5-nCoV: 550.4; IM Ad5-nCoV: 411.0) and BA.4/5 (IH Ad5-nCoV: 451.9; IM Ad5-nCoV: 300.9). After vaccination, pseudovirus neutralization antibody titers against wild-type SARS-CoV-2 in the IH Ad5-nCoV group moderately increased from 14 days and peaked at 3 months after vaccination, then slightly declined at 6 months, with GMTs of 796.9 (95% CI 635.6–999.1), 1026.2 (95% CI 792.7–1328.6) and 880.9 (95% CI 700.9–1107.2), respectively (Fig. 4). Compared with the GMTs of pseudovirus neutralization antibodies against wild-type SARS-CoV-2 in the IH Ad5-nCoV group, those in the IM Ad5-nCoV group were comparable at 14 days, but numerically lower at 3 and 6 months, with GMTs of 796.4 (95% CI 635.3–998.2), 681.6 (95% CI 542.2–856.9) and 520.0 (95% CI 413.1–654.6), respectively. In contrast to pseudovirus neutralization antibodies against wild-type SARS-CoV-2, those against BA.4/5 achieved comparable levels, with the peak GMTs at 3 months of 1061.0 (95% CI 800.1–1405.5) in the IH Ad5-nCoV group and 883.0 (95% CI 670.1–1163.4) in the IM Ad5-nCoV group. Although pseudovirus neutralization antibodies against XBB.1.16 were relatively lower in both vaccine groups compared to those against wild-type and BA.4/5 SARS-CoV-2, GMTs increased significantly after booster immunization, from 79.3 at baseline to the peak of 317.0 in the IH Ad5-nCoV group, and from 65.3 at baseline to the peak of 302.8 in the IM Ad5-nCoV group, both at 3 months. Compared to participants with a history of infection, those without SARS-CoV-2 infection history had numerically lower pseudovirus neutralization antibodies against wild-type SARS-CoV-2 and BA.4/5 variant but exhibited a greater increase 14 days after booster in both vaccine groups (Fig. S6). However, no difference in pseudovirus neutralization antibodies was observed against XBB.1.16 between participants with and without SARS-CoV-2 infection history.

Pseudovirus neutralizing antibody titers against wild-type SARS-CoV-2 (a), BA.4/5 variant (c), and XBB.1.16 (e) in the IM Ad5-nCoV group. Pseudovirus neutralizing antibody titers against wild-type SARS-CoV-2 (b), BA.4/5 variant (d), and XBB.1.16 (f) in the IH Ad5-nCoV group. IM Ad5-nCoV: day 0 (n = 60), day 14 (n = 60), month 3 (n = 58), month 6 (n = 57); IH Ad5-nCoV: day 0 (n = 61), day 14 (n = 61), month 3 (n = 60), month 6 (n = 58). No technical replicates. The p values are the results of comparison between different time points using two-sided mixed-effects models (day 0 versus day 14 and month 3 versus month 6). The p values for multiple comparisons have been adjusted. IM Ad5-nCoV adenovirus type 5 vectored COVID-19 vaccine through intramuscular injection, IH Ad5-nCoV adenovirus type 5 vectored COVID-19 vaccine through oral inhalation, GMT geometric mean antibody titer.
Enzyme-linked immunospot (ELISpot) responses against wild-type SARS-CoV-2 were detectable before the booster dose in over 90% of participants within both vaccine groups, with a mean number of spot-forming cells per 2 × 10⁵ cells of 25.8 (95% CI 19.6–31.9) for IFN-γ and 10.2 (95% CI 7.2–13.1) for IL-2 in the IM Ad5-nCoV group, 27.8 (23.0–32.6) for IFN-γ and 6.7 (95% CI 5.1–8.6) for IL-2 in the IH Ad5-nCoV group (Fig. 5). After the booster vaccination, the levels of IFN-γ and IL-2 against wild-type SARS-CoV-2 remained comparable to baseline levels at 14 days and 3 months but showed a slight decline at 6 months. In the IH Ad5-nCoV group, the mean number of spot-forming cells per 2 × 10⁵ cells for IFN-γ was 22.3 (95% CI 13.5–31.0) at 14 days, 22.8 (95% CI 12.6–32.9) at 3 months, and 10.6 (95% CI 5.4–15.8) at 6 months, and that for IL-2 was 9.1 (95% CI 5.9–12.2) at 14 days, 7.9 (95% CI 5.8–9.9) at 3 months, and 3.7 (95% CI 0.6–6.6) at 6 months. In the IM Ad5-nCoV group, the mean number of spot-forming cells per 2 × 10⁵ cells for IFN-γ was found to be 27.3 (95% CI 15.4–39.1) at 14 days, 23.9 (95% CI 17.8–29.9) at 3 months, and 14.9 (95% CI 5.0–24.9) at 6 months, and that for IL-2 was 10.5 (95% CI 7.7–13.4) at 14 days, 8.4 (95% CI 5.9–10.8) at 3 months, and 4.3 (95% CI 1.9–6.8) at 6 months. ELISpot responses against BA.4/5 at baseline were similar to those against wild-type SARS-CoV-2 and were detectable in over 90% of participants in both vaccine groups. After the booster vaccination, no elevation in the levels of IFN-γ and IL-2 was observed as well. Besides, no difference in ELISpot responses was observed among participants with versus without SARS-CoV-2 infection history (Fig. S7).

ELISpot responses for IFN-γ against wild-type SARS-CoV-2 (a) and BA.4/5 variant (b). ELISpot responses for IL-2 against wild-type SARS-CoV-2 (c) and BA.4/5 variant (d). Lines indicate the mean and error bars are 95% CIs. IM Ad5-nCoV against wild-type SARS-CoV-2: day 0 (n = 60), day 14 (n = 60), month 3 (n = 56), month 6 (n = 31); IH Ad5-nCoV against wild-type SARS-CoV-2: day 0 (n = 61), day 14 (n = 61), month 3 (n = 60), month 6 (n = 34). IM Ad5-nCoV against BA.4/5 variant: day 0 (n = 47), day 14 (n = 39), month 3 (n = 58), month 6 (n = 57); IH Ad5-nCoV against BA.4/5 variant: day 0 (n = 54), day 14 (n = 43), month 3 (n = 26), month 6 (n = 59). No technical replicates. The p values are the results of comparison between different time points using two-sided mixed-effects models (day 0 versus day 14 and month 3 versus month 6). The p values for multiple comparisons have been adjusted. IM Ad5-nCoV adenovirus type 5 vectored COVID-19 vaccine through intramuscular injection. IH Ad5-nCoV adenovirus type 5 vectored COVID-19 vaccine through oral inhalation, IFN interferon, IL interleukin, SFCs spot forming cells, PBMCs peripheral blood mononuclear cells.
The pattern of RBD-specific IgG antibody results was consistent with that of pseudovirus neutralization antibody. Specifically, the geometric mean concentration (GMC) of RBD-specific IgG antibody against wild-type SARS-CoV-2 exhibited a notable increase after vaccination in both vaccine groups, from 1071.2 (95% CI 833.1–1377.3) BAU/mL at baseline to a peak of 2174.1 (95% CI 1890.4–2500.5) BAU/mL at 14 days in the IM Ad5-nCoV group, from 1635.9 (95% CI 1339.0–1998.7) BAU/mL at baseline to a peak of 2779.8 (95% CI 2432.1–3177.2) BAU/mL at 3 months in the IH Ad5-nCoV group. In comparison, RBD-specific IgG antibody levels against BA.4/5 were notably lower, but significant increases were still observed from 14 days post-vaccination compared to baseline in both boosting groups (Fig. S3). Compared to participants with a history of infection, those without SARS-CoV-2 infection history had numerically lower baseline RBD-specific IgG antibody levels against wild-type SARS-CoV-2 and BA.4/5 variant but reached a similar or greater peak level 14 days after booster in both vaccine groups (Fig. S8).
After the booster vaccination, the geometric mean concentration (GMC) of RBD-specific IgA antibody against XBB.1.5 increased significantly in both vaccine groups, from 168.7 U/mL at baseline to the peak of 427.6 U/mL in the IM Ad5-nCoV group, and from 229.1 at baseline to the peak of 477.4 in the IH Ad5-nCoV group, at 14 days (Fig. S4). Although the GMC of RBD-specific IgA antibody against XBB.1.5 decreased slightly, it remained at a relatively high level in both vaccine groups 3 and 6 months after the booster vaccination. Similarly, the stratified results showed that participants without a SARS-CoV-2 infection history had numerically lower baseline RBD-specific IgA antibodies and reached similar peak levels 14 days after the booster compared with those with a history of infection (Fig. S9).
Safety analysis
During the six-month follow-up period after the booster vaccination, 25 episodes of serious adverse events (SAEs) were reported in 22 participants, within 9 (0.4%) of 2050 participants from the IM Ad5-nCoV group, 7 (0.3%) of 2039 participants from the IH Ad5-nCoV group, and 6 (0.3%) of 2008 participants from the control group (Table S3). The incidence of SAEs did not significantly differ between the two vaccine groups and the control group (IM Ad5-nCoV vs. control: p = 0.4618; IH Ad5-nCoV vs. control: p = 0.8025). Among the 19 SAEs reported in both vaccine groups, the most common were respiratory thoracic and mediastinal disorders (6, 31.6%) and nervous system disorders (4, 21.1%). The one with an allergic reaction in the IH Ad5-nCoV group was considered related to the vaccination, while the remaining SAEs were not vaccine-related. A comprehensive list of all SAEs is provided in Table S4.


