Characteristics of included studies
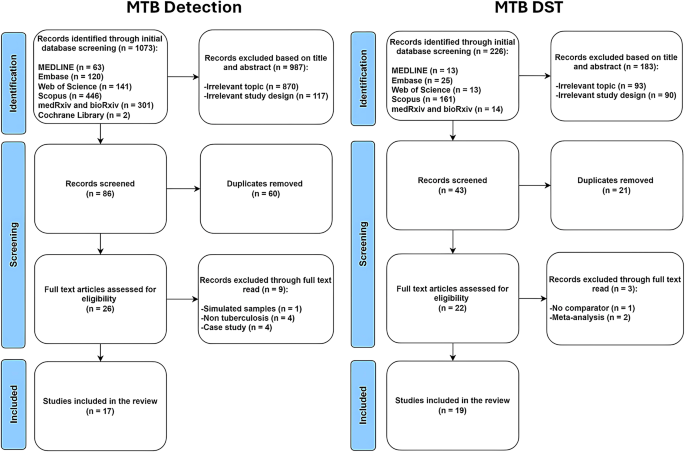
Comprehensive search across multiple databases yielded a total of 1,073 records about MTB detection and 226 records about MTB drug susceptibility. The full search strategies were summarized in Supplementary Tables 1 and 2. Following a thorough screening process, 17 studies about MTB detection were included while 19 studies about MTB drug susceptibility were selected (Fig. 1).
To facilitate our analysis, studies were classified into two categories: those focusing on the detection of MTB (Table 1) and those focusing on the detection of DR-MTB (Table 2). Among the 32 articles, 13 articles related to MTB detection only22,23,24,25,26,27,28,29,30,31,32,33,34,15 articles focused on DR-MTB detection only34,35,36,37,38,39,40,41,42,43,44,45,46,47,48,49, while 4 articles examined both50,51,52,53. Among the four studies which analyzed both MTB detection and DST50,51,52,53, only the study by Sun et al. was included in the meta-analyses on MTB detection because this is the only study which has results for diagnostic accuracy measures51. In the meta-analyses on DST, only the study by Nilgiriwala et al. was included among the four studies, since it has data on diagnostic accuracy measures for DST, specifically in detecting isoniazid, rifampicin, pyrazinamide, ethambutol, streptomycin, amikacin, and moxifloxacin resistance50.
Detection of MTB
Out of the 17 articles, nine were retrospective cross-sectional while eight were prospective cross-sectional. GridION was predominantly used in these studies (12 out of 17), followed by minION alone (4 out of 17), then the combination of both sequencing platforms (1 out of 17). No study used Flongle or PromethION. Included studies were published between 2017 and 2024 (Table 1).
Risk of bias and applicability assessment for detection of MTB
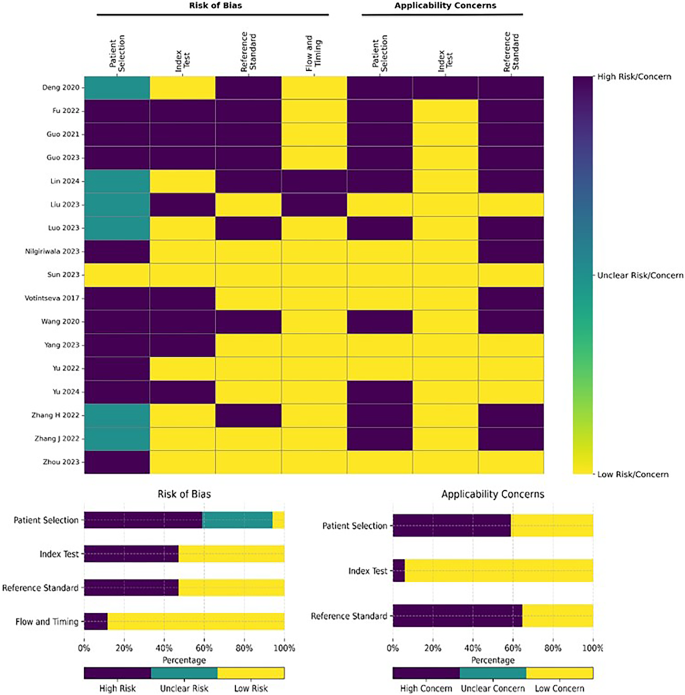
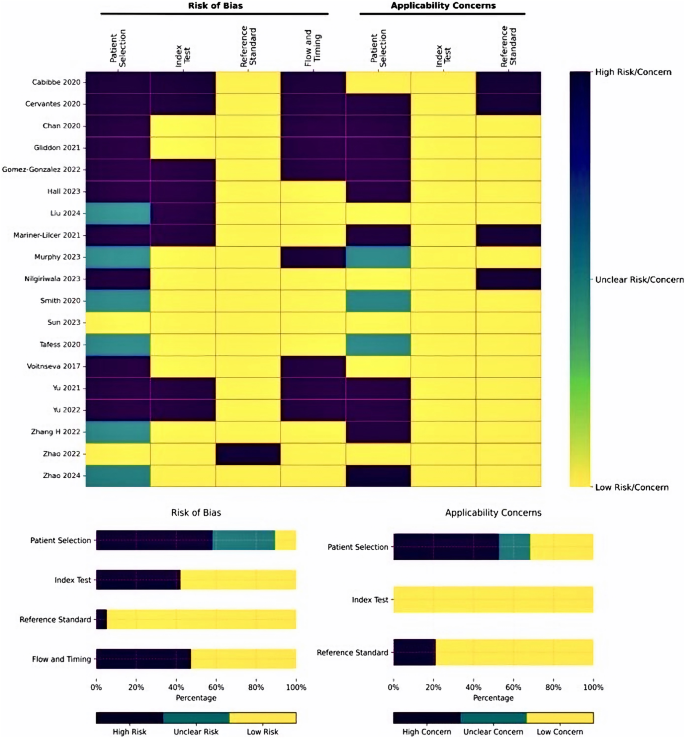
Separate assessments of the risk of bias and applicability concerns using the QUADAS-2 tool were performed for studies on MTB detection (Fig. 2) and drug susceptibility (Fig. 3). Mainly, patient selection is the top source of bias and applicability concerns. In the 17 MTB detection studies selected, only one explicitly described the sampling strategy, consisting of consecutive enrollment51 (Table 1). Further, nine of the selected studies focused on general infections, lower respiratory tract infections, and pneumonia; thus, their MTB results derived from secondary analyses; hence, the heightened applicability concerns. Additionally, among the 17 MTB detection studies, nine adopted a retrospective cross-sectional design (Fig. 2), increasing the risk of bias concerning the evaluated index test, reference test, and the flow of timing in these studies.
Meta-analysis of MTB detection studies
Heterogeneity test. Our results showed that the logit-transformed sensitivity did not correlate with logit transformed false positive rate (1-specificity) (Spearman correlation − 0.486 (p = 0.356)). Our analysis revealed no threshold effect among the included studies. Higgin’s I2 of the diagnostic measures ranged from 63 to 88%.
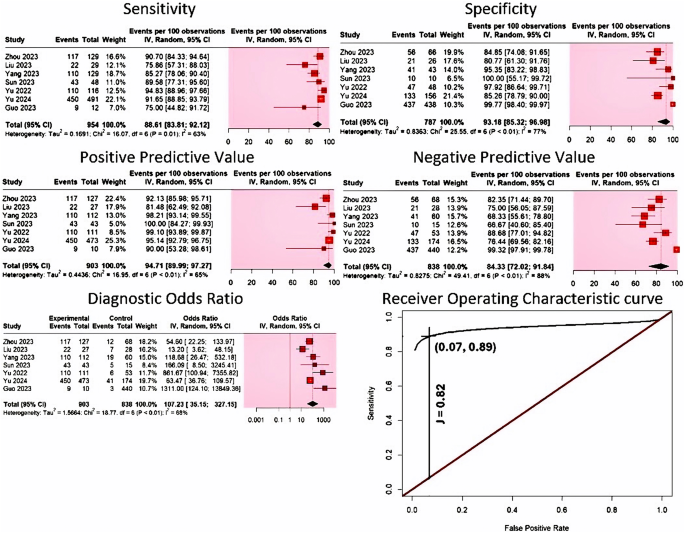
Evaluation of diagnostic accuracy. The meta-analysis for detecting MTB included seven studies, with 1,741 specimens from 1,709 adult participants. All of the included studies to diagnose MTB utilized the GridION platform. Our results indicate that the diagnostic sensitivity of nanopore sequencing in detecting MTB ranged from 75 to 95%, while its specificity varied between 81% and 100%. Nanopore sequencing had a pooled sensitivity of 88.61% (95% CI 83.81–92.12%, I2 = 63%), and a pooled specificity of 93.18% (95% CI 85.32–96.98%, I2 = 77%) (Fig. 4). Its PPV ranged from 81 to 100%, while its NPV varied between 67% and 99%. The pooled PPV value was 94.71% (95% CI 89.99–97.27%, I2 = 65%), while its pooled NPV was computed to be 84.33% (95% CI: 72.02–91.84%, I2 = 88%) (Fig. 4). Our results also indicated that AUC was excellent [AUC = 0.932 (SE = 0.03)], with a remarkable wide DOR range, where values varied from 13 to 1,311. Pooled DOR was determined to be 107.23 (95% CI 35.15–327.15), with moderate heterogeneity (I2 = 65%) (Fig. 4). The summary receiver operating characteristic (SROC) curve for nanopore sequencing in MTB detection is shown in Fig. 4. Youden’s J index was calculated to be 0.82 (Fig. 4).
Detection of DR-MTB
Among 19 studies selected, 12 studies adopted a prospective cross-sectional design, while 7 used a retrospective cross-sectional approach (Table 2). MinION alone was predominantly used in these studies (14 out of 19), followed by GridION alone (3 out of 19), then the combination of both sequencing platforms (2 out of 19). These studies span publication years from 2017 to 2024. No study used Flongle or PromethION.
Risk of bias and applicability assessment for DR-MTB
Among the 19 DR-MTB studies, two studies followed STARD recommendations54; one study stated the use of consecutive sampling51 and one study mentioned use of random sampling42. Further lack of clinical information about the samples contributed to the applicability concerns in drug resistance studies. Additionally, 6 out of the 19 DR-MTB studies employed a case-control design, amplifying the risk of bias related to the index test, reference test, and the sequencing of events in these investigations (Fig. 3).
Meta-analysis of studies on DR-MTB
Heterogeneity test. Our results showed that the logit-transformed sensitivity did not correlate with the logit-transformed false positive rate (1-specificity) across all drug resistance groups [Spearman coefficient range: -0.5 to 0.5 (p-value range = 0.5 to 1)]. Higgin’s I2 of the diagnostic measures ranged from 0 to 87%.
Evaluation of diagnostic accuracy. The meta-analysis on detecting DR-MTB comprised 917 adult participants from five studies, all of which utilized the MinION platform. Our results indicated that pooled sensitivity of nanopore sequencing was lower than its specificity in detecting any drug resistance; pooled sensitivity ranged from 77.99 to 93.66%, while the pooled specificity varied between 94.84% and 99.47% (Table 3). The pooled PPV ranged from 87.57 to 100% while the pooled NPV varied between 91.27% and 99.46% (Table 3).
Our results indicate that among first-line DST, accurate detection of pyrazinamide-resistance was most challenging in terms of sensitivity and PPV. Conversely, detection of rifampicin resistance was easiest for nanopore sequencing among first-line DST in terms of sensitivity and PPV. Pooled specificity of nanopore sequencing was highest in detecting ethambutol-resistance and lowest in isoniazid resistance. Pooled NPV, on the other hand, was highest in detecting pyrazinamide-resistance and lowest in rifampicin-resistance. Meanwhile, among second-line DST, the pooled sensitivity and NPV of nanopore sequencing were the highest but PPV was the lowest in detecting kanamycin-resistance. The highest specificity was noted in detecting ofloxacin resistance. Detection of streptomycin-resistance appeared to be more challenging; pooled specificity and NPV were at its lowest for MTB resistant to this aminoglycoside. Interestingly, pooled sensitivity was lowest, but pooled PPV was the highest for moxifloxacin-resistance. Resistance to ethionamide43, ciprofloxacin40, capreomycin40, and bedaquiline47 were each investigated by only one study; diagnostic accuracy measures are shown in Table 4. However, only one bedaquiline-resistant sample was detected in the sole study it was mentioned, making calculation of diagnostic accuracy measures impossible. Furthermore, no study mentioned about pretomanid or linezolid resistance. Among these three drugs, nanopore sequencing had the lowest diagnostic accuracy measures in detecting ethionamide resistance.
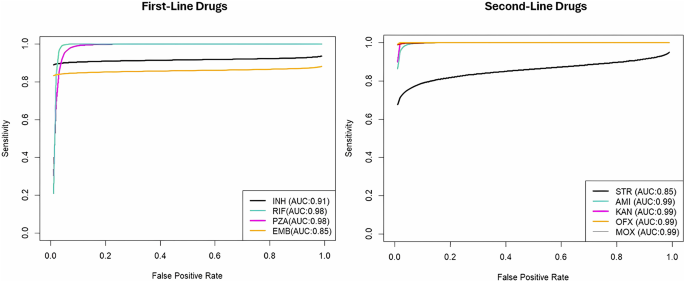
The AUC indicated clinically acceptable performance across all DST studies, with values ranging from 0.85 to 0.990 (Table 5), observed for both first-line and second-line DST (Fig. 5)55. AUC was excellent in most of the DSTs investigated; it was lower than 0.9 only in detection of ethambutol and streptomycin resistance. The range of pooled DOR was remarkably wide; values varied from 106.94 to 8943.00 (Table 5). DOR was the lowest in detecting isoniazid and streptomycin resistance, and the highest in detecting pyrazinamide and moxifloxacin resistance.
Subgroup analyses
Subgroup analyses for accuracy in MTB detection were performed based on study design, nanopore sequencing platform, and reference standard. No subgroup analysis was done to investigate drug resistance because of the low number of studies and potential subgroups composed of only one study.
Retrospective studies are more heterogeneous in all diagnostic accuracy measures (I2 = 73–93%). Studies which used CSTB are more heterogeneous in more diagnostic accuracy measures, specifically in sensitivity, PPV, and DOR. Heterogeneity due to the type of nanopore sequencing cannot be analyzed; no study using MinION was included in the quantitative synthesis. Most of the subgroup analyses performed indicated no statistically significant subgroup effect (p > 0.1). For brevity, individual analyses were only shown for statistically significant subgroup effects (Table 6).
Subgroup Analysis: Effect of Study Design on Sensitivity and AUC for MTB detection. Study design significantly affects the sensitivity of nanopore sequencing in MTB detection, as shown by a statistically significant subgroup effect (p = 0.08). Prospective studies have higher sensitivity (p = 0.08) than retrospective ones (Table 6). However, since fewer studies and participants contributed data to the prospective subgroup (3 studies) than to the retrospective subgroup (4 studies), evidence is not enough to confidently conclude that there is a true subgroup effect. Furthermore, there is substantial unexplained heterogeneity between the studies within the retrospective subgroup (retrospective: I2 = 76%), making the validity of the sensitivity estimate for retrospective studies uncertain, as individual study results are inconsistent. The estimate for prospective study design is most likely valid because of the homogeneity of studies (prospective: I2 = 0%). The AUC in MTB detection is significantly higher in studies using prospective design (0.94 vs. 0.91, p = 0.03).
Subgroup Analysis: Effect of Reference Standard on Specificity for MTB detection. Reference standard significantly affects the specificity of nanopore sequencing in MTB detection, as shown by a statistically significant subgroup effect (p = 0.07). Studies which used a reference standard other than CSTB have higher specificity than those which used CSTB (Table 6). However, since fewer studies contributed data to the non-CSTB subgroup (2 studies), evidence is not enough to confidently conclude that there is a true subgroup effect. Furthermore, there is substantial unexplained heterogeneity between the trials within each of these subgroups (CSTB: I2 = 47%; non-CSTB: I2 = 66%). Therefore, the validity of the specificity estimate for each subgroup is uncertain, as individual study results are inconsistent.
Subgroup Analysis: Effect of Reference Standard on DOR and AUC for MTB detection. Reference standard significantly affects the DOR of nanopore sequencing in MTB detection, as shown by a statistically significant subgroup effect (p = 0.07). Studies which used a reference standard other than CSTB have higher DOR (p = 0.07) than those which used CSTB (Table 6). However, since fewer studies contributed data to the non-CSTB subgroup (2 studies), evidence is not enough to confidently conclude that there is a true subgroup effect. Furthermore, there is substantial unexplained heterogeneity between the studies within the CSTB subgroup (retrospective: I2 = 67%), making the validity of the DOR estimate for studies which used CSTB uncertain, as individual study results are inconsistent. The DOR estimate for studies which used a reference standard other than CSTB is most likely valid because of the unremarkable heterogeneity of studies (non-CSTB: I2 = 12%). The AUC in MTB detection is significantly higher in studies which used non-CSTB reference standard (0.94 vs. 0.90, p = 0.08).
Sensitivity analyses
Sensitivity analyses were performed based on study design, platform, and reference standard and were conducted to investigate the robustness of diagnostic accuracy measures for DR-MTB detection.
Sensitivity analyses for Isoniazid Resistance Detection. In the detection of isoniazid resistance (Table 7), the omission of a study that used retrospective design decreased the overall DOR and AUC; the retrospective study cited has higher sensitivity. On the contrary, omission of a study that used GridION increased the overall DOR and AUC; the study which used GridION has remarkably lower specificity and NPV. Likewise, exclusion of the study which used Illumina WGS increased the overall DOR and AUC; the study which used Illumina WGS as reference standard has remarkably lower sensitivity and PPV. The heterogeneity of specificity and NPV decreased upon elimination of the study which used GridION while the heterogeneity of sensitivity decreased after removal of the study which used Illumina WGS. The heterogeneity of NPV and DOR is stable despite the removal of the study which used Illumina WGS; the heterogeneity of PPV also remained the same after removal of the study which used GridION. For the rest of accuracy measures, the heterogeneity increased after removal of the study which used either GridION or Illumina WGS.
Sensitivity analyses for Rifampicin Resistance Detection. In the detection of rifampicin resistance (Table 8), the omission of a study using retrospective design increased the overall DOR and AUC; the retrospective study cited has remarkably lower NPV and smaller 95% confidence interval lower limit for specificity. On the other hand, omission of a study that used GridION or Illumina WGS increased only the overall DOR; AUC is unchanged. The study which used GridION has higher PPV but remarkably lower NPV. Remarkably lower sensitivity is observed in the use of Illumina WGS. The heterogeneity of PPV and NPV decreased upon elimination of the study which used GridION while the heterogeneity of sensitivity and DOR decreased after removal of the study which used Illumina WGS. Specificity remained completely homogenous even after removal of the study which used retrospective design or GridION. For the rest of accuracy measures, the heterogeneity increased after removal of the study which used either GridION or Illumina WGS.
Sensitivity analyses for Ethambutol Resistance Detection. In the detection of ethambutol resistance (Table 9), the omission of a study that used GridION increased the overall DOR and AUC; the study which used GridION has remarkably lower specificity, PPV and NPV. Similarly, the omission of a study that used Illumina WGS increased the overall AUC; the study which used Illumina WGS has remarkably lower sensitivity and NPV. The analyses for PPV and DOR were not done due to absence of false positives. Sensitivity analyses based on study design were not performed due to the lack of retrospective study. The heterogeneity of specificity and PPV decreased after the elimination of the study which used GridION while that of sensitivity decreased upon removal of the study which used Illumina WGS. For the rest of accuracy measures, the heterogeneity increased after removal of the study which used either GridION or Illumina WGS.
Sensitivity analyses for Streptomycin Resistance Detection. In the detection of streptomycin resistance (Table 10), the omission of a study that used GridION increased the overall DOR and AUC; the study which used GridION has remarkably lower values in all accuracy measures. Likewise, the exclusion of the study which used Illumina WGS increased the overall DOR and AUC; the study which used Illumina WGS as reference standard has remarkably lower sensitivity. Sensitivity analyses based on study design were not performed due to the lack of retrospective study. The heterogeneity of PPV did not change after the elimination of the study which used GridION. For the rest of accuracy measures, the heterogeneity increased after removal of the study which used either GridION or Illumina WGS.
Sensitivity analyses for Pyrazinamide Resistance Detection. In the detection of pyrazinamide resistance (Table 11), the omission of a study that used Illumina WGS increased the overall AUC; the study which used Illumina WGS has remarkably lower sensitivity and NPV. The analyses for PPV and DOR were not done due to absence of false positives. Sensitivity analyses based on study design and type of nanopore sequencing were not performed due to the lack of retrospective study. The heterogeneity of sensitivity barely changed; the heterogeneity of specificity increased while that of NPV decreased.
Sensitivity analyses for Amikacin Resistance Detection. In the detection of amikacin resistance (Table 12), the omission of a study that used Illumina WGS did not change the overall AUC and the heterogeneity of specificity and NPV. The analyses for sensitivity, PPV, and DOR were not done due to absence of false negatives and false positives. Sensitivity analyses based on study design and type of nanopore sequencing were not performed due to the lack of retrospective study.
Sensitivity analyses were not conducted for kanamycin, ofloxacin, and moxifloxacin resistance since only two studies investigate each antibiotic resistance.

