Clinical features of COVID-19 patients
This study collected 116 samples from COVID-19 patients, including 70 bronchoalveolar lavage fluid (BALF) samples and 46 sputum samples (Fig. 1, Table 1 and Supplementary Data 1). The metagenomic sequencing (mNGS) generated an average of 1.92 × 10⁸ sequence reads, with 1.21 × 10⁸ metatranscriptome reads (Supplementary Data 1, 2 and Supplementary Data 2–2). COVID-19 virus detection was successful in 111 of the 116 cases, resulting in an overall detection rate of 95.69% (Supplementary Table 1). Among the BALF samples, 66 of 70 tested positive, yielding a detection rate of 94.29%, while 45 of 46 sputum samples were positive, with a detection rate of 97.83%. The clinical characteristics of the patients are summarized in Fig. 1, with 75% (87/116) being male. The patients were categorized as mild (23.28%, 27/116), severe (20.69%, 24/116), and critical (56.03%, 65/116).
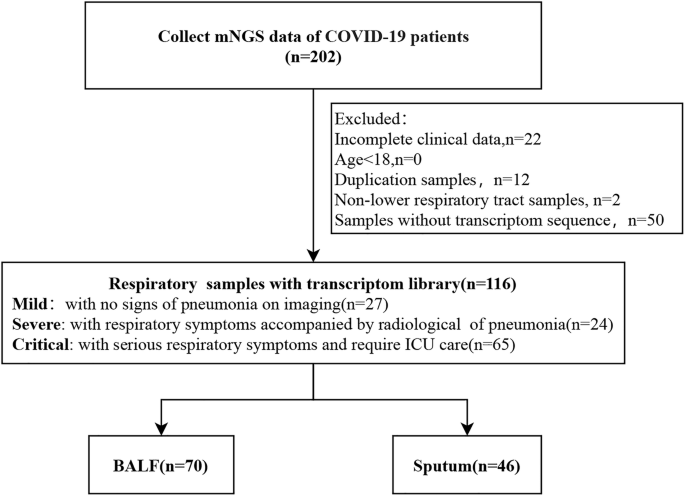
Summary of sample types and patient information used in this study.
Genotyping and variant detection in COVID-19 patients
Genotyping analysis was performed on 86 complete SARS-CoV-2 genomes from the 116 COVID-19 positive patients. The results showed variation in viral genotype distribution across patients with different clinical severities (Fig. 2A; Supplementary Data 3). In mild cases, eight viral branches were identified, including B (the first discovered), B.1.1.529 (Omicron), BA.5.2.48, BA.5.2.49, DY.1, DY.2, DY.4, and BF.7.14.5 (Omicron variants). In severe cases, the B.1.1.161 (early COVID-19 variant) branch was also detected. Critically ill patients exhibited an expanded viral genotype profile, with the addition of B.1.1.161, BF.7.14.4, and BF.7.14 (Omicron variants), bringing the total number of branches to 10 (Fig. 2A; Supplementary Data 4).

A Distribution of SARS-CoV-2 lineages across mild, severe, and critical patients. The X-axis represents the sample count, and the Y-axis displays the different SARS-CoV-2 lineages. B Phylogenetic tree depicting 86 pathogens. C Heatmap showing 11 gene mutations for each sample. The X-axis corresponds to the samples, and the Y-axis represents the SARS-CoV-2 genes.
While SARS-CoV-2 genotypes were largely similar across patients with different disease severities, variations emerged as the disease progressed, suggesting a potential role of viral evolution in disease progression. To investigate this further, we constructed phylogenetic trees for each strain and analyzed single nucleotide polymorphisms (SNPs). SNPs were detected in all 86 cases (Fig. 2B; Supplementary Data 5). Additionally, mutation distribution was examined across 11 genes, revealing prominent mutations in the spike protein (S) and ORF1ab genes. Although mutation counts varied among patients, no significant differences were observed between mild, severe, and critically ill cases (Fig. 2C).
Species-level microbial diversity differences in lower respiratory tract samples from mild, severe, and critical COVID-19 patients
In this study, we analyzed 70 BALF and 46 sputum samples from 116 COVID-19 patients to evaluate respiratory microbiome diversity across mild, severe, and critical cases. Significant differences in microbial composition were observed at the species level (Fig. 3A). The Chao index increased with disease severity, indicating greater species richness in critically ill patients (Fig. 3B). However, no significant differences were found in the Shannon and Simpson indices at the species level (Fig. 3C, D).

A–D Comparison of metatranscriptome microbiome α-diversity at the species level among mild (light beige), severe (peach), and critical (dark brown) patient groups based on metatranscriptomic data. A, Observed species count (feature number). B Chao index. C Shannon index. D Simpson index. E Comparison of microbiome β diversity at the species level based on Bray-Curtis dissimilarity index, covering mild, severe, and critical patient groups. F Principal Coordinate Analysis (PCoA) based on Bray-Curtis dissimilarity index. Mild patients are represented by light beige points, severe patients by peach points, and critical patients by dark brown points. R and P values correspond to the results of the ANOSIM test. Statistical significance is indicated as follows: ns (P > 0.05), *(P < 0.05), **(P < 0.01), ***(P < 0.001), and ****(P < 0.0001).
We calculated the Bray-Curtis distance between species in mild, severe, and critically ill patients. Critically ill patients exhibited a significantly greater Bray-Curtis distance compared to mild and severe cases, with no significant difference observed between the mild and severe groups (Fig. 3E). PCoA analysis further revealed that the microbiota abundance in critically ill patients was significantly higher than in the other groups (Fig. 3F). Overall, these findings suggest that the respiratory microbiome in critically ill COVID-19 patients shows greater species-level variability and dispersion than in mild and severe cases.
Next, we analyzed species-level diversity in sputum samples and found no significant differences in alpha diversity among mild, severe, and critically ill patients (Supplementary Fig. 1A–D). However, β-diversity analysis revealed significant differences between mild and critically ill patients, as well as between severe and critically ill patients, indicating notable variations in overall diversity (Supplementary Fig. 1E). PCoA further highlighted distinct microbial differences among these groups (Supplementary Fig. 1F). In BALF samples, alpha diversity at the species level also showed no significant differences across patient groups (Supplementary Fig. 1G–J). However, β-diversity analysis identified significant differences between mild and critically ill patients, reflecting substantial shifts in overall microbial diversity (Supplementary Fig. 1K). Unlike sputum samples, the PCoA plot for BALF did not indicate significant differences in species abundance (Supplementary Fig. 1L).
In addition, we analyzed species-level metagenomic diversity in 70 BALF and 46 sputum samples (Supplementary Fig. 2A). The Chao index increased significantly with disease severity, while the Shannon index decreased, indicating reduced microbial evenness (Supplementary Fig. 2B, C). The Simpson index showed no significant differences (Supplementary Fig. 2D). β-diversity analysis revealed significant differences between mild and critically ill patients, as well as between severe and critically ill patients, highlighting notable variations in overall microbial composition (Supplementary Fig. 2E). PCoA further illustrated distinct microbial differences among these groups (Supplementary Fig. 2F).
Genus-level microbial diversity differences in lower respiratory tract from mild, severe, and critical COVID-19 patients
We further performed a comprehensive analysis of microbiome differences at the genus level among mild, severe, and critical ill COVID-19 patients. The Chao index, used to measure α-diversity, revealed significant differences in species composition across the three groups, with higher values associated with increased disease severity (Fig. 4A, B). In contrast, the Shannon and Simpson indices showed no significant differences (Fig. 4C, D). We also calculated the Bray-Curtis distance at the genus level and found a significant increase in distance between critically ill patients and both mild and severe cases, while no significant difference was observed between mild and severe groups (Fig. 4E). PCoA analysis further demonstrated a significant difference in the absolute abundance of microbiomes between critically ill and mild patients (Fig. 4F). Overall, these findings suggest that the respiratory microbiome of critically ill COVID-19 patients is more diverse and dispersed at the genus level compared to mild and severe cases.

A–D Comparison of metatranscriptome microbiome α-diversity at the genus level among mild (light beige), severe (peach), and critical (dark brown) patient groups based on metatranscriptomic data. A Observed genus count (feature number). B Chao index. C Shannon index. D Simpson index. E Comparison of microbiome β diversity at the genus level based on Bray-Curtis dissimilarity index, covering mild, severe, and critical patient groups. F Principal Coordinate Analysis (PCoA) based on Bray-Curtis dissimilarity index. Mild patients are represented by light beige points, severe patients by peach points, and critical patients by dark brown points. R and P values correspond to the results of the ANOSIM test. Statistical significance is indicated as follows: ns (P > 0.05), *(P < 0.05), **(P < 0.01), ***(P < 0.001), and ****(P < 0.0001).
Additionally, we further examined α-diversity in sputum samples at the genera level and found no significant differences among mild, severe, and critically ill patients (Supplementary Fig. 3A–D). However, β-diversity analysis revealed a significant difference between severe and critically ill patients, although overall diversity remained relatively stable (Supplementary Fig. 3E, F). Similarly, in BALF samples, α-diversity at the genera level showed no significant differences across the groups (Supplementary Fig. 3G–J). In contrast, β-diversity analysis of BALF samples indicated a significant difference between mild and critically ill patients, with overall diversity showing notable changes (Supplementary Fig. 3K, L).
We also investigated the metagenomics diversity of 70 BALF samples and 46 sputum samples at the genera level (Supplementary Fig. 4A). Notably, the observed species and the Chao index increased significantly with disease severity, while the Shannon index and Simpson indices did not demonstrate significant differences at the species level (Supplementary Fig. 4B–D). However, β-diversity analysis revealed significant differences between mild and critically ill patients, as well as between severe and critically ill patients, with overall diversity showing notable variations (Supplementary Fig. 4E). The PCoA plot further highlighted distinct differences among these groups (Supplementary Fig. 4F).
Microbial composition in lower respiratory tract from mild, severe, and critical COVID-19 patients
To gain a clearer understanding of microbial distribution across varying severities of COVID-19, we analyzed BALF and sputum samples from the lower respiratory tract. Our results revealed significant shifts in microbial composition among mild, severe, and critically ill patients (Fig. 5 and Supplementary Fig. 5). The detail information at phylum level was shown in Supplementary Table 2 and Fig. 5A. In mild cases, Firmicutes were the dominant microbiota, but their prevalence dramatically decreased to 4.57% in critically ill patients (Fig. 5A). In severe cases, Bacteroidetes were most prominent, accounting for 39.16% of the microbiota, compared to 12.89% in mild cases and 2.91% in critically ill cases (Fig. 5A). Furthermore, among critically ill patients, Actinobacteria and Proteobacteria were the most dominant, making up 59.35% and 31.63% of the microbiota, respectively. In contrast, these groups accounted for 36.8% and 6.83% in mild cases and 9.62% and 5.68% in severe cases.

A Average composition and relative abundance of phylogeny microbial communities in the mild, severe and critical patients with COVID-19. B Average composition and relative abundance of microbial communities in genus patients with mild, severe and critical illness.
Of note, as shown in Fig. 5B and Supplementary Table 3, the proportions of the genera Streptococcus and Rothia decreased progressively with worsening disease severity, with Rothia becoming undetectable in critically ill patients. On the other hand, the genera Corynebacterium and Pantoea were observed only in severe and critically ill patients, comprising 38.50% and 8.13% of the microbiota in critically ill patients, respectively. Additionally, the genera Streptomyces was found exclusively in critically ill patients (Fig. 5B).
To investigate the differences in bacteria, fungi, and viruses across mild, severe, and critical patients, we also analyzed the top 50 genera with the highest relative abundance for each microbe. The Kruskal-Wallis test was used for statistical analysis, with a significance level of p-value < 0.05. Finally, 46 bacterial, 31 fungal, and 10 viral genera showed significant differences. Hierarchical cluster analysis based on their relative abundances generated heatmaps for these differentially abundant genera (Supplementary Fig. 5A, B).
Microbial biomarkers in lower respiratory tract from mild, severe, and critical COVID-19 patients
We conducted a detailed analysis of the microbial community structure associated with the mild, severe, and critical groups using LEfSe, an algorithm designed to identify high-abundance biomarkers and estimate the effect size of each taxon differing among the groups (Fig. 6A, B; Supplementary Table 4 and Supplementary Table 5).

A, B Microbial biomarkers were identified using the Linear Discriminant Analysis Effect Size (LEfSe) algorithm. The histogram of unique biomarkers with an LDA score > 3.5 is presented, where the length of the bars represents the effect size of significantly different species. A Biomarkers at the genus level. B Biomarkers at the species level. R and P values correspond to the results of the ANOSIM test. Statistical significance is indicated as follows: ns (P > 0.05), *(P < 0.05), **(P < 0.01), ***(P < 0.001), and ****(P < 0.0001).
A total of 30 distinct genera were identified across the groups. In the mild group, 10 potential markers were identified, including Tannerella, Thermobaculum, Granulicatella, Moraxella, Parvimonas, Abiotrophia, Rothia, Porphyromonas, Actinomyces and Streptococcus. The severe group revealed 8 potential markers, such as Mogibacterium, Veillonella, Alloprevotella, Haemophilus, Candida, Leptotrichia, Capnocytophaga and Prevotella. For the critical group, 12 potential markers were identified, including Bacillus, Mycobacterium, Vibrio, Escherichia, Cutibacterium, Pedobacter, Acinetobacter, Klebsiella, Herbaspirillum, Streptomyces, Pantoea and Corynebacterium (Supplementary Table 4). A total of 42 distinct species were identified across the groups. In the mild group, 18 potential markers were identified, including Actinomyces graevenitzii, Streptococcus pneumoniae, Herbaspirillum autotrophicum, Rothia mucilaginosa, and Streptococcus mitis. The severe group revealed 15 potential markers, such as Candida albicans, Streptococcus oralis, Capnocytophaga granulosa, Haemophilus influenzae, and Porphyromonas endodontalis. For the critical group, 9 potential markers were identified, including Corynebacterium striatum, Pantoea endophytica, Pedobacter nutrimenti, Klebsiella pneumoniae, Cutibacterium acnes, Acinetobacter baumanni, Escherichia coli, Shewanella chilikensis, and Human alphaherpesvirus 1 (Supplementary Table 5).
We also drew the heatmap depicting the relative abundance of bacteria biomarkers identitied in LEfSe across mild, severe, and critically ill patients. The results showed that Shewanella chilikensis, Pedobacter nutrimenti, Pantoea endophytica, Klebsiella pneumoniae, Escherichia coli, Cutibacterium acnes, Corynebacterium striatum, Acinetobacter baumannii, and Herbaspirillum autotrophicum were more prevalent in critically ill patients, with other strains being less abundant (Supplementary Fig. 6A). The significant differences in Candida albicans among the groups also showed in Supplementary Fig. 6B. Specifically, there were marked differences in Candida albicans between mild and severe patients, and between severe and critically ill patients, but not between mild and critically ill patients.
Human herpesvirus 1 (HHV-1)36, also known as herpes simplex virus type 1 (HSV-1), is a common human virus that causes infections in various parts of the body, most commonly the oral region. Further statistical (Supplementary Fig. 6C) analysis indicated that HHV-1 differed significantly between mild and severe patients, as well as between mild and critically ill patients, with no significant difference between severe and critically ill patients.
Differential microbial diversity in lower respiratory tract samples across clinical groups
To further explore the relationship between the lower respiratory microbiota and COVID-19 severity, we examined the association between the Shannon index, Chao index and clinical outcomes. The Chao index was significantly associated with ICU admission, use of mechanical ventilation, and patient survival. However, it showed no clear relationship with intubation, underlying infection diseases, or treatments including antibiotics, antifungals, and anti-tuberculosis drugs, nor with patient age (Fig. 7A–I). In contrast, the Shannon index was not significantly associated with ICU admission, mechanical ventilation, intubation, comorbidities, or any of the treatments or age. Notably, however, it was significantly correlated with patient mortality (Fig. 8A–I).

A ICU Admission. B Mechanical Ventilation. C Endotracheal Intubation. D Mortality Rate. E Underlying Diseases. F Antibiotic Treatment. G Antifungal Treatment. H Antitubercular Treatment. I Age Effect. R and P values correspond to the results of the ANOSIM test. Statistical significance is indicated as follows: ns (P > 0.05), *(P < 0.05), **(P < 0.01), ***(P < 0.001), and ****(P < 0.0001).

A ICU Admission Rate. B Mechanical Ventilation Rate. C Endotracheal Intubation Rate. D Mortality Rate. E, Underlying Diseases. F Antibiotic Treatment. G Antifungal Treatment. H Antitubercular Treatment. I Age Effect. R and P values correspond to the results of the ANOSIM test. Statistical significance is indicated as follows: ns (P > 0.05), *(P < 0.05), **(P < 0.01), ***(P < 0.001), and ****(P < 0.0001).
To study the relative abundance differences between groups for different clinical outcomes and bacteria biomarkers from lefse, A volcano plot was shown in Fig. 9 and Supplementary Table 6. First, compared to non-ICU patients, four bacterial species were significantly upregulated in ICU patients, including Prevotella denticola, Tannerella, Capnocytophaga granulosa, and Capnocytophaga sputigena, while Lactobacillus casei, Acinetobacter, and Bifidobacterium were significantly downregulated. These findings provide further support for the potential link between the lower respiratory microbiome and the severity of COVID-19 in patients.

A–D, Microbes with significant abundance differences are represented in orange (upregulated microbes) or cyan (downregulated microbes); microbes with no significant abundance differences are marked in gray. A ICU Admission. B Mortality. C Mechanical Ventilation. D Endotracheal Intubation. R and P values correspond to the results of the ANOSIM test. Statistical significance is indicated as follows: ns (P > 0.05), *(P < 0.05), **(P < 0.01), ***(P < 0.001), and ****(P < 0.0001).
Comparing mortality to non-mortality, we found a significant increase in Acinetobacter abundance (Fig. 9A and Supplementary Table 7). Conversely, 19 bacterial species showed a notable decrease, including Haemophilus influenzae, Lactobacillus casei, Prevotella denticola, Porphyromonas endodontalis, Prevotella salivae, Porphyromonas KLE 1280, Prevotella pallens, Alloprevotella tannerae, Granulicatella elegans, Prevotella veroralis, Porphyromonas sp. 279, Rothia mucilaginosa, Streptococcus oralis, Actinomyces graevenitzii, Capnocytophaga granulosa, Streptococcus pneumoniae, Capnocytophaga sputigena, Prevotella nigrescens, and Streptococcus mitis (Fig. 9B).
Next, we compared the microbiome patients requiring mechanical ventilation to those not needing it. Nine bacterial species showed significantly increased abundance, including Lactobacillus casei, Acinetobacter HMSC24B09, Prevotella denticola, Tannerella sp. HOT-286, Porphyromonas KLE 1280, Capnocytophaga sputigena, Porphyromonas sp. 279, Abiotrophia defectiva, and Capnocytophaga granulosa. In contrast, Granulicatella elegans showed a significant decrease (Fig. 9C and Supplementary Table 8).
In addition, when comparing patients who required intubation with those who did not, seven bacterial species had significantly increased abundance, including Prevotella denticola, Tannerella sp. HOT-286, Abiotrophia sp. HMSC24B09, Capnocytophaga sputigena, Capnocytophaga granulosa, Abiotrophia defectiva, and Capnocytophaga gingivalis, while Lactobacillus casei showed a significant decrease (Fig. 9D and Supplementary Table 9). To further assess the relationship between clinical factors and lower respiratory tract microbiota diversity, we constructed multivariate linear regression models to evaluate the impact of ICU admission, mechanical ventilation, intubation, mortality, and age on diversity indices. The analysis revealed a statistical association between mortality and both the Chao and Shannon indices, although the explanatory power was low (R² = 0.1221) (Supplementary Data 6). Based on this, we further analyzed the association between eight clinical variables and diversity indices in a subset of 74 samples and found no significant correlations (Supplementary Table 10). Taken together, these microbiome shifts likely reflect the progression of disease and varying treatment needs, suggesting a link between microbial composition and clinical outcomes.


