Development of bovine primary lung cell-derived pulmosphere
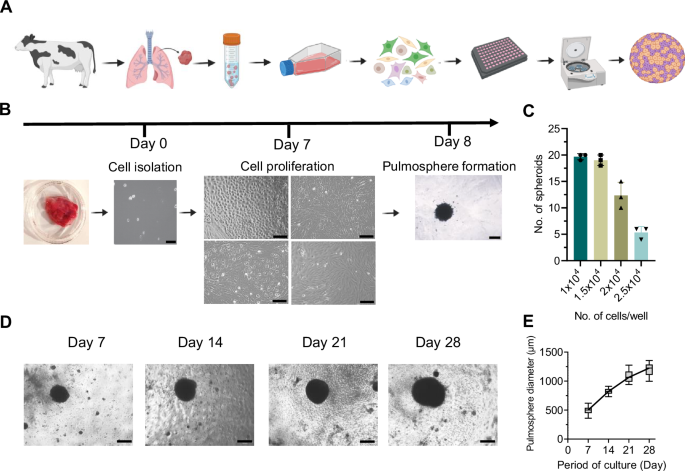
To establish a pulmosphere model for the study of ex vivo TB infection, first, the method for generation of pulmospheres from bovine primary lung mixed cells population was optimized. Figure 1A depicts the overall workflow used for the generation of the pulmosphere. To optimize the formation of uniform spheroids, four different seeding densities of the mixed primary lung cells per well were evaluated, including 1 × 10⁴, 1.5 × 10⁴, 2 × 10⁴, and 2.5 × 10⁴ cells in a U bottom 96-well tissue culture plate. Notably, round-shaped, self-assembled, and reproducible spheroids were generated within 24 h following centrifugation-based spheroid assembly (Fig. 1B). The optimum seeding densities were found to be 1 × 10⁴ and 1.5 × 10⁴ cells per well, while a higher number of cells resulted in an improper assembly leading to irregularly shaped cell clumps. Figure 1C depicts the relative number of spheroids generated at different cell seeding concentrations. These findings indicated that Poly-HEMA-coated U-bottom plates provided an appropriate surface for pulmosphere development at the calibrated cell densities. Over a monitoring period of 28 days, the growth dynamics of bovine lung multi-cell spheroids were characterized. The mean diameter of the spheroids increased from 494 ± 70.58 μm at Day 7 post-sphere formation to 1205.4 ± 106.76 μm at Day 28 (n = 20), revealing a substantial expansion in size over 4 weeks (Fig. 1D, E). Further, the influence of primary lung cell culture passage number on pulmosphere formation was explored. Cells from passages zero and one lead to proper spheroid formation, while cells from the latter passages reduced the success rate of spheroid formation as well as resulted in irregular-shaped cell clumps (Supplementary Fig. 1A, B). This relationship suggests a significant impact of the passage number on spheroid morphology and integrity, underscoring the importance of early passages for maintaining the characteristics of pulmospheres derived from primary lung cells.
A Schematic cartoon representation of the protocol for bovine 3D pulmosphere development. Illustration was made using Biorender. B Bovine lung primary cells were isolated and grown for 7 days showing multiple cell types, pulmosphere was assembled and images were taken after 24 h. Scale bars: 400 μm for 4× images (Day 0, day 7) and 200 μm for 10× images (Day 8). C Bar graph depicts the average number of compact pulmospheres formed with respect to the different cell seeding densities. Individual data points represent biological replicates (n = 3). D Representative images of pulmospheres captured at every week till 28 days. E The box plot depicts the relative size of pulmospheres over the period of culture (n = 20). Scale bars: 400 μm for 4× images. Data information: In (C, E) data are presented as mean ± sd. Statistical analysis included an unpaired two-tailed t-test for comparison between two. A 95% confidence interval or 0.05 threshold for significance (p < 0.05) was used in statistical tests.
Assessment of live and dead cells in pulmospheres
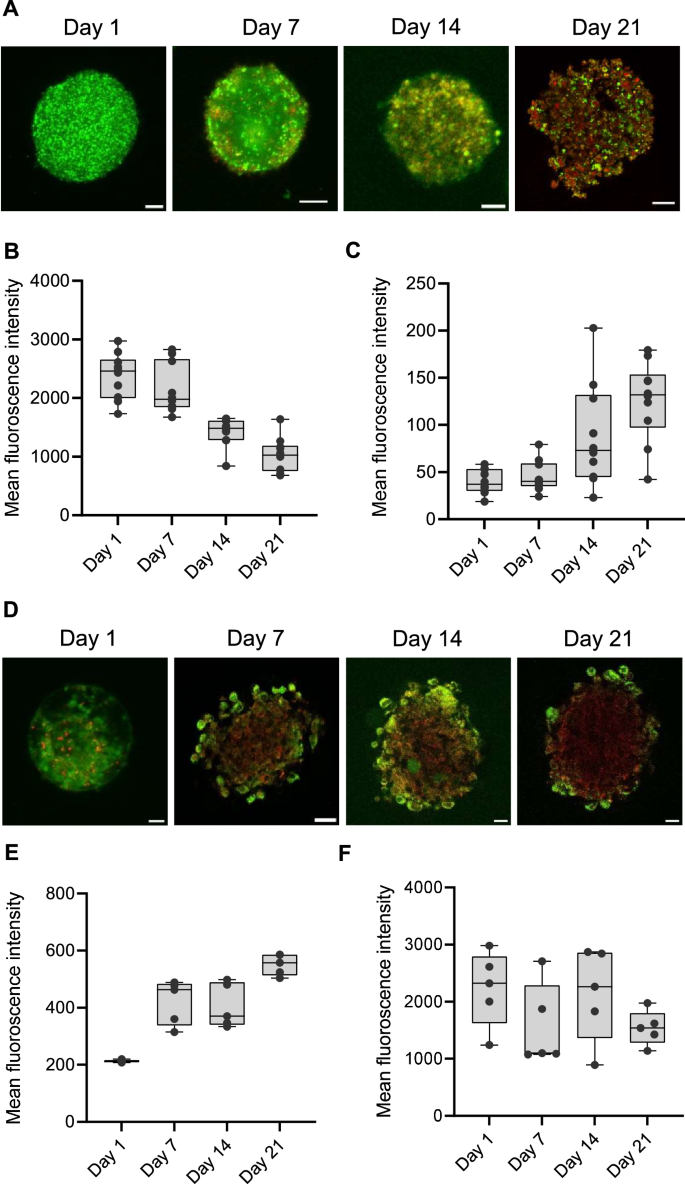
To further extend the characterization of pulmospheres, we conducted a live-dead cell assessment for a period of 21 days to monitor changes in cell viability and the progression of cell death within the pulmospheres over time. For this, cells were stained with carboxyfluorescein succinimidyl ester (CFSE) and propidium iodide (PI), where CFSE selectively labels live and actively proliferating cells, and PI specifically stains non-viable cells (Fig. 2A). The box plot represents the mean fluorescence intensity of CFSE-stained live cells (Fig. 2B) and PI-stained dead cells (Fig. 2C), providing a quantitative measure of both live and dead cells at each time point within the pulmosphere. The results reveal a clear trend of increasing number of dead cells as the incubation period progresses, which is in contrast to the reducing number of live cells. From Day 1 till Day 7, the CFSE fluorescence was more less stable with minimal PI fluorescence, indicating a negligible dead cell population within the pulmospheres during the early phase of pulmosphere growth (Supplementary movies 1, 2), A sharp slope of the PI fluorescence from Day 7 to Day 14 indicate a rise in dead cell population, which increases considerably by Day 21 (Supplementary movie 3, 4). This pronounced increase in dead cell population highlights a cumulative effect of environmental stressors such as nutrient depletion, hypoxia, and oxidative stress within the 3D structure towards the later stage of pulmosphere growth.
A Representative images of live/dead cells in pulmospheres at Day 1, 7, 14, and 21. Live cells are stained with CFSC (Green) and dead cells are stained with PI (Red). The box plot represents the mean fluorescence intensity of (B) CFSE-stained live cell green fluorescence and (C) dead cell red fluorescence of the pulmospheres (n = 10) over 21 days experimental period. D The representative images of Hypoxia (Red) and ROS (Green) status in the pulmospheres. The box plot represents the mean fluorescence intensity of Hypoxia (E) and ROS (F) levels over the experimental period (n = 5). Images were captured using a Super-Resolution Microscope in Airyscan mode. Fluorescence values were measured using a wide-field fluorescence microscope. The scale bar represents 20 μm, 40× magnification.
Hypoxia and oxidative stress conditions in 3D pulmospheres
Spheroid or organoid cultures often develop oxygen gradients due to limited diffusion of oxygen and nutrients to the inner core leading to heterogeneous cell populations, including hypoxic cores, proliferative zones, and necrotic regions25. Hypoxia and reactive oxygen species (ROS) levels play critical roles not only in determining the physiological status of model system but also influences effectiveness of the intended therapy. Hence, next, we evaluated hypoxia and oxidative stress status in the pulmospheres using the ROS-ID® Hypoxia/Oxidative Stress Detection Kit (Enzo Life Sciences, Inc.). Figure 2D shows a representative image of the central z-stack of pulmospheres, providing a focused view of the hypoxia and ROS distribution within a specific depth. However, the distribution of ROS and hypoxia signals varies across different z-stacks due to the heterogeneous nature of the 3D structure of the pulmospheres (Supplementary movies 5, 6, 7, 8). The box plot reflects the mean fluorescence intensity derived from the maximum intensity projections across all z-stacks, offering a comprehensive and averaged representation of the overall hypoxia (Fig. 2E) and ROS levels within the pulmospheres (Fig. 2F). The fluorescence intensity depicting hypoxia levels show a significant increase from Day 1 to Day 7, which remained steady till Day 14, and subsequently exhibited sharp increase by Day 21. This indicates that as the pulmospheres mature, the core regions become increasingly oxygen-deprived due to potentially limited diffusion of oxygen. Unlike hypoxia, ROS levels in the pulmospheres were found to exhibit a distinct bimodal curve with a drop in ROS levels at Day 7 compared to the levels at Day 1, surging back to initial levels by Day 14, and again dropping considerably by Day21 (Supplementary movies 5,6,7,8). While hypoxia consistently increases over time, ROS levels do not follow the same linear pattern highlighting the complexity of cellular responses in 3D environment.
3D pulmospheres recapitulate cellular heterogeneity and extracellular matrix enrichment over 2D monolayer culture
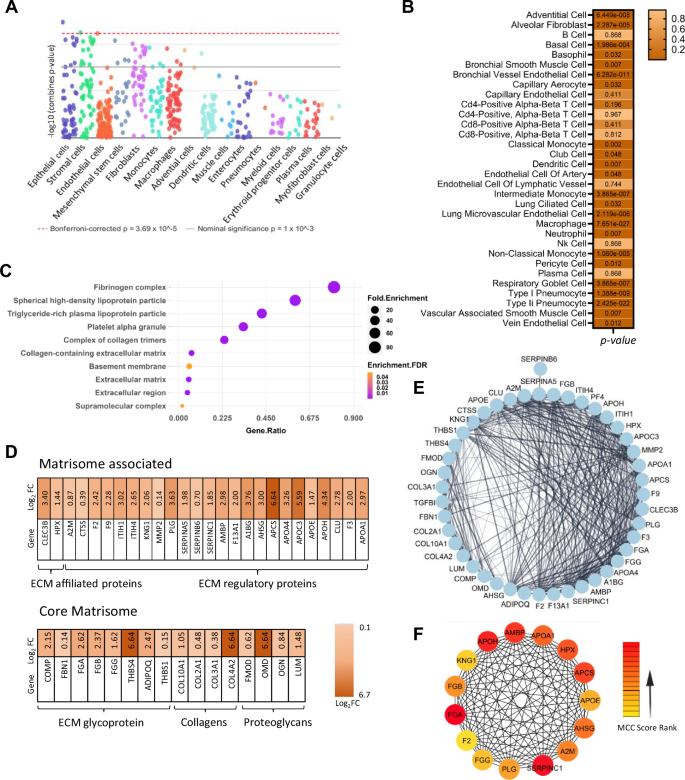
To investigate the multicellularity of the 3D pulmospheres and their functional profile we performed liquid chromatography-mass spectrometry (LC-MS) analysis of the whole protein extract 24 h post-assembly of the pulmospheres. The proteomics workflow is provided in Supplementary Fig 2. A pool of 2748 peptides was detected in the proteome of the pulmospheres (Supplementary data 1), which were then subjected to global cell-type-specific enrichment analysis using the web-based tool WebCSEA26, that unveiled the presence of 17 cell types (Fig. 3A). Further analysis of lung tissue-specific cell typing reveals 32 different types of lung cells encompassing epithelial, endothelial, fibroblast, pneumocytes, and an array of immune cells including macrophage, dendritic cells, neutrophil, T-cell, B-cells, plasma cells, etc. highlighting the complex multi-cellularity of the pulmosphere (Fig. 3B). A comparative assessment of protein expression patterns was performed between 2D monolayer cells, and 3D pulmospheres at 24 h post-culture to understand the functional differences between two culture systems. Supplementary Fig 3 A-C, depicts the comparative omics analysis features: (A) Volcano plot, (B) PCA analysis, and (C) hierarchical clustering of peptide abundance) of the DEPs of 3D vs. 2D culture proteome.
A Array of different cell types identified in bovine 3D Pulmosphere using WebCSEA. B Lung-tissue specific cell type enrichment analysis using “Tabula Sapiens” single cell analysis showed the presence of 22 cell types as significantly enriched, p < 0.05. C Gene Ontology of cellular composition in 3D pulmosphere vs monolayer 2D lung cell culture. D Protein expression profile of ECM and associated proteins in 3D pulmosphere. E Densely interconnected protein network of ECM proteins derived via STRING analysis. F Top 15 critical hub genes involved in the structural organization of 3D pulmosphere were identified using Cyto-Hubba, a Cytoscape plug-in.
Strikingly, upon gene-ontology analysis (GO) of cellular components, a pronounced upregulation of the fibrinogen complex and collagen-containing extracellular matrix (ECM) proteins were found in the case of 3D pulmospheres (Fig. 3C). Subsequent analysis of these proteins using a matrisome database revealed a strong association of the majority of the core matrisome and matrisome-associated proteins in the case of 3D pulmospheres27 (Fig. 3D). This finding suggests a fundamental shift in the protein expression profile in the 3D spheroids that emphasizes the significance of the 3D cellular organization compared to 2D in promoting the deposition of ECM components, which are integral part of lung basement membrane. Further insight into the upregulated ECM network within the 3D pulmosphere was gained through the identification of closely interconnected ECM proteins by STRING analysis (Fig. 3E). The top 15 major ECM proteins showing a higher number of interconnected nodes were APOH, APOA1, HPX, AMBP, APCS, APOE, AHSG, A2M, SERPINC1, PLG, FGG, F2, FGA, FGB, KNG1 (Fig. 3F). In the context of lung ECM formation, FGA, FGB, and FGG contribute to the ECM assembly through fibrin formation and provide structural integrity of the ECM. A2M and KNG1 are associated with protease inhibition, potentially regulating ECM remodeling processes. APOA1, APOE, and HPX are involved in lipid metabolism and transport, which can influence ECM stability. AMBP, APCS, APOH, and AHSG contribute to ECM formation by interacting with ECM proteins and also contribute modulation of inflammation and cell adhesion response. This intricate web of ECM components highlights the dynamic interactions and organization that contribute to the pulmosphere integrity and functionality. In addition to the upregulation of ECM proteins, several biological pathways were upregulated in the pulmosphere (Supplementary data 2). These include tissue homeostasis, epithelial cell proliferation, positive regulation of cell development, regulation of vasculature development, response to wounding, humoral immune response, negative regulation of apoptotic signaling pathway, and response to oxidative stress, etc. indicate that our 3D model not only captures the diverse cell types present in the lungs but also represents the complex extracellular matrix milieu pivotal for integrity of multicellular spheroid. To validate the reproducibility and consistency of the cellular composition in the pulmospheres and the ECM components, subsequently we analyzed the statistical variation of these parameters in the transcriptome data across 3 biological replicates, and no significant variability was observed between the pulmospheres (Supplementary Fig. 4A, B). The collective presence of distinct cell populations and ECM proteins underscores the relevance of the 3D model in recapitulating the complexity of the lung microenvironment.
Development of pulmosphere TB disease model
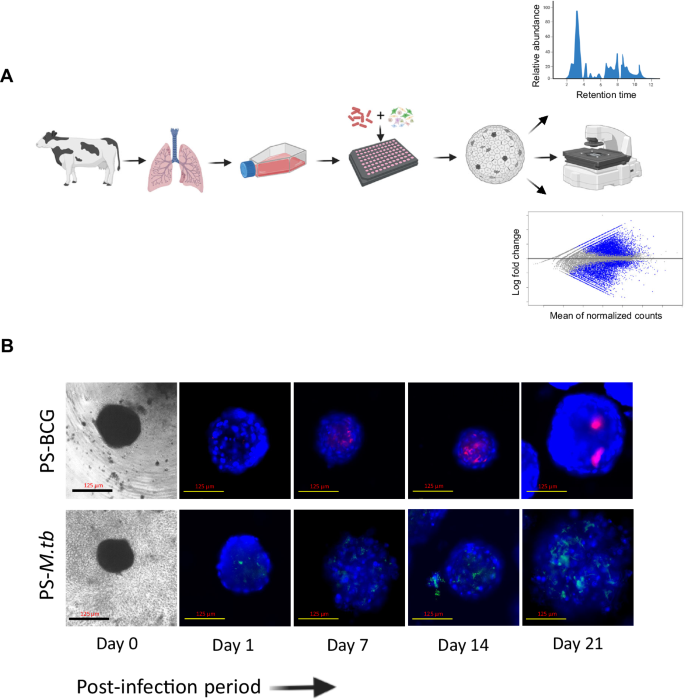
The establishment of a bovine pulmosphere TB disease model represents an advancement, offering a platform for thorough exploration into the complex interplays between M. tuberculosis or M. bovis and bovine lung cells within a relevant context. To construct the bovine TB infection model, both virulent M. tuberculosis and the vaccine strain M. bovis Bacille Calmette-Guérin (BCG) were employed. The inclusion of the vaccine strain enabled a comparative analysis of the host response elicited by a virulent M. tuberculosis strain versus an avirulent M. bovis BCG strain. For real-time monitoring of infection dynamics, fluorescent protein-expressing variants of M. tuberculosis and M. bovis BCG were used28. Figure 4A depicts the workflow employed for the generation of the pulmosphere TB infection model. Seven days following the culture of bovine primary lung cells, the cells were subjected to infection with a pre-calibrated multiplicity of infection (MOI) of 1:10. This time point was chosen to harness the maximal heterogeneity of cell types inherent to early-passage of primary lung cells, ensuring an optimal representation of the multicellular microenvironment in the development of the disease models. After infection, lung cells were assembled into 3D pulmospheres using the same methodology established for the formation of uninfected 3D pulmospheres. The infected 3D pulmospheres were monitored over 21 days through live fluorescence microscopy at weekly intervals (Fig. 4B). This longitudinal observation unveiled distinctive infection patterns between the attenuated vaccine strain M. bovis BCG and the virulent M. tuberculosis strain. The BCG strain exhibited restrained replication within the pulmospheres throughout the three-week study, predominantly localizing to focal infection. In stark contrast, the virulent M. tuberculosis strain demonstrated unhindered replication throughout infection and displayed widespread dissemination to all regions of the pulmospheres from the initial foci of infection (Fig. 4B). The successful establishment of the bovine 3D pulmosphere TB infection model has ushered in the ability to visualize the progression of infection dynamics ex vivo. This dynamic system provides a unique window into the complex interplay between mycobacterium species and bovine lung cells, facilitating further studies to understand the deeper insights into the mechanisms underpinning TB pathogenesis.
A Schematic cartoon representation of the protocol for the establishment of bovine 3D pulmosphere infection and downstream analysis. Illustration was made using Biorender. B Seven-day cultures of bovine primary lung cells were infected with either M. bovis BCG-mCherry or M. tb-eGFP at an MOI of 1:10 and pulmospheres were assembled (Day 0), and monitored under live cell imaging fluorescence microscope weekly till 21 days. The figures depict representative photographs of infected pulmospheres at different time points. The scale bars represent 125 μm for 10× images.
Transcriptomic and proteomic analysis of host response to BCG and M. tuberculosis infection in pulmosphere model
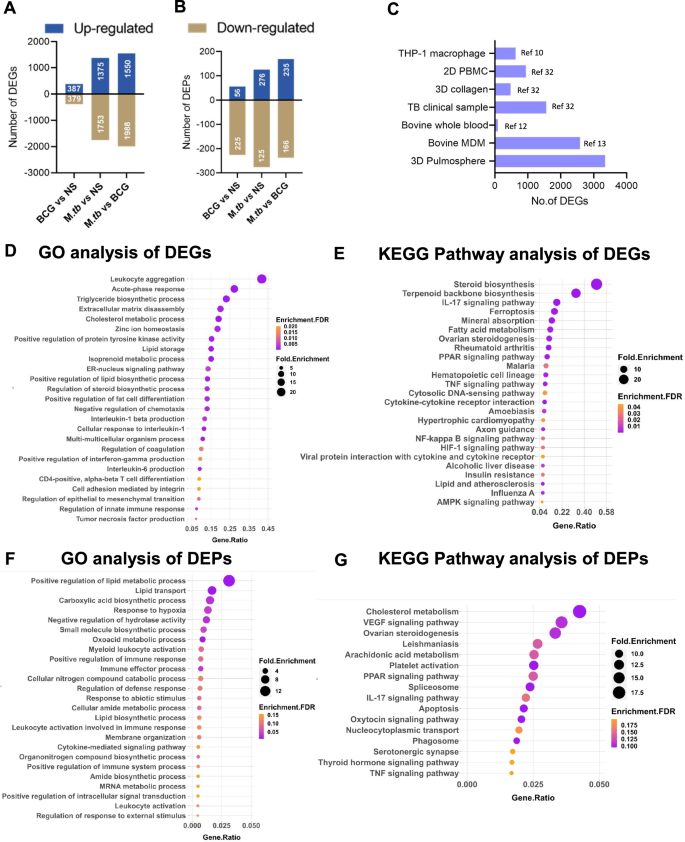
To decipher the intricate host–pathogen interactions occurring at the early phase of infection, we analyzed the global transcriptomic and proteomic patterns of the infected and uninfected pulmospheres at 24 h post-sphere formation. A stringent analytical framework was employed, wherein genes and proteins demonstrating at least a 2-fold change, and with an adjusted p-value of <0.05 were deemed differentially expressed. The proteome and transcriptome data analysis workflow were provided in Supplementary Figs. 2 and 5, respectively. Supplementary Figs. 6A-D and 7A-E depict the comparative omics analysis features (Volcano plot, PCA analysis, and hierarchical clustering) of the transcriptome data for PS-BCG and PS-M. tb compared to uninfected pulmospheres, respectively. Comparative analysis revealed that the bovine pulmospheres exhibited substantial transcriptional and proteomic responses upon infection with M. bovis BCG and M. tuberculosis strains (Figs. 5, 6). Specifically, 766 differentially expressed genes, and 281 differentially expressed proteins were identified in M. bovis BCG-infected pulmospheres, whereas 2129 DEGs and 402 DEPs were detected in M. tuberculosis-infected pulmospheres, relative to uninfected counterparts indicating that a greater number of genes exhibited altered expression levels in response to the virulent M. tuberculosis challenge, both at the transcript and protein levels (Fig. 5A, B). Further, compared to BCG infection 3828 genes and 406 proteins were differentially expressed in the case of M. tuberculosis infection (Fig. 5A, B). This finding underlines the intricate and multifaceted nature of the host response to M. tuberculosis infection when compared with the avirulent M. bovis BCG-induced response. Additionally, a comparison with the publicly available transcriptome data from a variety of M. tuberculosis infection models employed by several previous studies revealed that the number of DEGs in our pulmosphere model was notably higher following M. tuberculosis infection (Fig. 5C)7,10,29,30,31,32. This finding highlights the 3D pulmosphere as a more robust system compared to the single-cell, or PBMC-based models representing an enormous depth of complexity and cellular responses induced during M. tuberculosis infection.
A No. of differentially expressed proteins in BCG and M. tb infected pulmospheres. B No. of differentially expressed genes in BCG and M. tb infected pulmospheres. C Comparative view of the DEG no. in PS-M. tb (this study) and selected TB infection model reported previously. The numbers in the parenthesis are the corresponding references. Biological processes (D), and KEGG pathway analysis of DEGs (E) of PS-BCG over uninfected pulmospheres. FDR < 0.05, and gene number >5 in a pathway were used as cutoff values. Biological processes (F), and KEGG pathway analysis of DEPs (G) of PS-BCG over uninfected pulmospheres, respectively. FDR < 0.05, and gene number >5 in a pathway were used as cutoff values.
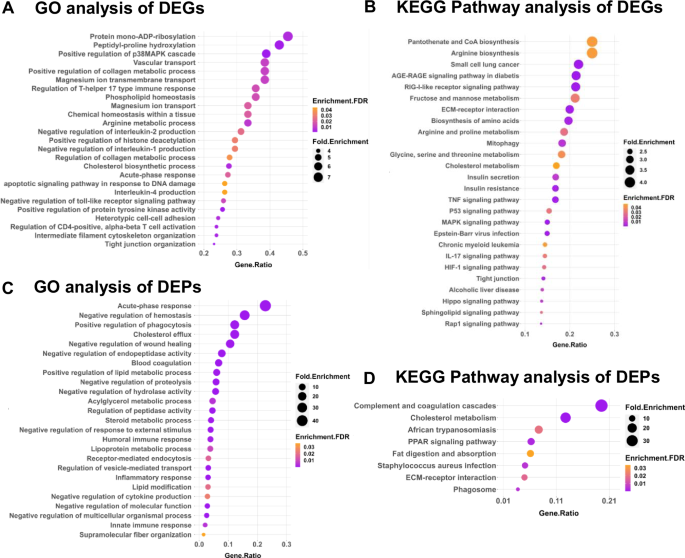
Biological processes (A) and KEGG pathway (B) analysis of DEGs of PS-M.tb over uninfected pulmospheres FDR < 0.05, and gene number >5 in a pathway were used as cutoff values. C, D Biological processes (A) and KEGG pathway (B) analysis of DEPs of PS-M.tb over uninfected pulmospheres FDR < 0.05, and gene number >5 in a pathway were used as cutoff values.
Functional enrichment analysis of differentially expressed genes following M. tuberculosis and M. bovis BCG infection
To gain insights into the biological implications of the observed differential expression, we performed GO and Kyoto Encyclopaedia of Genes and Genomes (KEGG) pathway enrichment analyses on upregulated and downregulated genes and proteins. Functional enrichment of the upregulated DEGs into the biological process via GO analysis reveals three major themes within the top-25 GO terms: immune response, cellular organization and ECM modification, and lipid metabolism were up-regulated in BCG-infected pulmosphere compared with the uninfected pulmosphere (Fig. 5D). Pathways related to activation of innate immune responses, IFN-γ, TNF-α, IL-1β, IL-6 production, leukocyte aggregation, and acute phase response were upregulated in the case of BCG infection. In contrast, clusters of genes belonging to leukocyte activation, differentiation, proliferation, and chemotaxis were downregulated (Supplementary Fig. 8A). Further, KEGG pathway analysis of the DEGs in the BCG group showed additional upregulation of IL-17, TGF-beta, Cytosolic DNA sensing pathway, PPAR, and NF-kappa B signaling pathways as major immune-related pathways (Fig. 5E). In contrast, the top-down regulated immune pathways were complemented and coagulation cascades, neutrophil extracellular trap formation, Rap 1 signaling pathway, and Toll-like receptor signaling pathway (Supplementary Fig. 8 B).
Functional enrichment via GO analysis of the DEPs in the BCG-infected pulmospheres reveals significant upregulation of similar immune response-related genes and lipid biosynthetic pathways as observed in the case of DEGs, however, several additional metabolic pathways such as carboxylic acid biosynthesis, amide metabolism, and mRNA metabolic processes, etc. were found to be upregulated (Fig. 5F). However, KEGG pathway analysis did not show any significantly upregulated pathway (Fig. 5G). GO analysis of the downregulated proteins showed oxidative phosphorylation, AGE-RAGE signaling, Th17 differentiation, and NOD-like receptor signaling pathway as the major enriched pathways (Supplementary Fig. 9A). KEGG analysis of DEPs identified downregulation of pathways related to several cancer types, phagocytosis, adipocytokine signaling, and RIG-I-like receptor signaling (Supplementary Fig. 9 B).
On the other hand, in the case of M. tuberculosis infection, the immune response related to GO-BP terms shows upregulation of Th-17, Th-2 (IL-4), acute phase response, and genes related to negative regulation of IL-1, IL-2 production, and apoptotic signaling pathway (Fig. 6A). Additionally, the KEGG pathway analysis indicated AGE-RAGE signaling pathway, RIG-1-like receptor signaling pathways, ECM-Receptor interaction, mitophagy, TNF and IL-17 signaling pathways, MAPK Signaling, RAP-1, and HIF-1 signaling pathways as some of the leading upregulated pathways in case of M. tuberculosis-infected pulmosphere (Fig. 6B). Whereas, the downregulated pathways include complement and coagulation cascades, cell cycle process, ribosome biogenesis pathways, and neutrophil extracellular trap formation pathways (Supplementary Fig. 10A). KEGG analysis identifies mitochondrial respiratory chain complex assembly as one of the major downregulated pathways (Supplementary Fig. 10 B).
Functional enrichment via GO analysis of the DEPs in the case of M. tuberculosis infection led to the upregulation of several biological processes under GO-BP terms including acute phase response, Cholesterol, and lipid metabolism, positive regulation of phagocytosis, negative regulation of wound healing, humoral immune response, inflammatory and innate immune response (Fig. 6C), However, KEGG pathway analysis reveals upregulation of additional pathways, such as the complement and coagulation cascades, PPAR signaling pathway, and ECM- Receptor interaction in case of M. tuberculosis infection (Fig. 6D), Notably, both GO-BP terms and the KEGG pathways involving the downregulated genes remain similar to that of the DEGs, respectively (Supplementary Fig. 11A, B).
Protein interaction network, hub genes, and functional clusters
Next, to have an in-depth understanding of the functional interactions among DEGs, we constructed protein-protein interactions (PPI) maps using STRING software, and identified the potential interacting network of proteins (Supplementary data 3). The significantly interacting proteins from STRING analysis were subsequently analyzed via the molecular complex detection (MCODE) algorithm using Cytoscape to identify the key fundamental process modulated during infection. A total of ten clusters were identified among the upregulated genes of BCG-infected pulmospheres, whereas 36 clusters were identified among the genes of M. tuberculosis-infected pulmospheres. The top up-regulated cluster in the case of BCG infection was identified with an MCODE score of 19.8, whereas in the case of downregulated genes, 14 clusters were found with the highest score of 31.43 (Supplementary data 4). To investigate the biological and immunological behavior of the highly interconnected upregulated modules, we performed GO enrichment using ClueGo on the top two MCODE clusters shown in Supplementary Fig. 12A, and Supplementary Fig. 12B. Subsequently, ClueGo analysis reveals sterol biosynthetic process, isoprenoid biosynthetic process, cellular response to interleukin-1; and neutrophil migration, regulation of macrophage activation and positive regulation of type-2 immune responses were the major networks in the upregulated top two highly interconnected gene clusters during BCG infection (Supplementary Fig. 12C, D). Further, Cytohubba analysis reveals HMGCR, HMGCS1, SQLE, FDT1, FDPS, MSMO1, CYP51A1, DHCR24, MVD, and LSS are the key genes among all the upregulated genes in the case of BCG infected pulmospheres (Supplementary Fig. 12E).
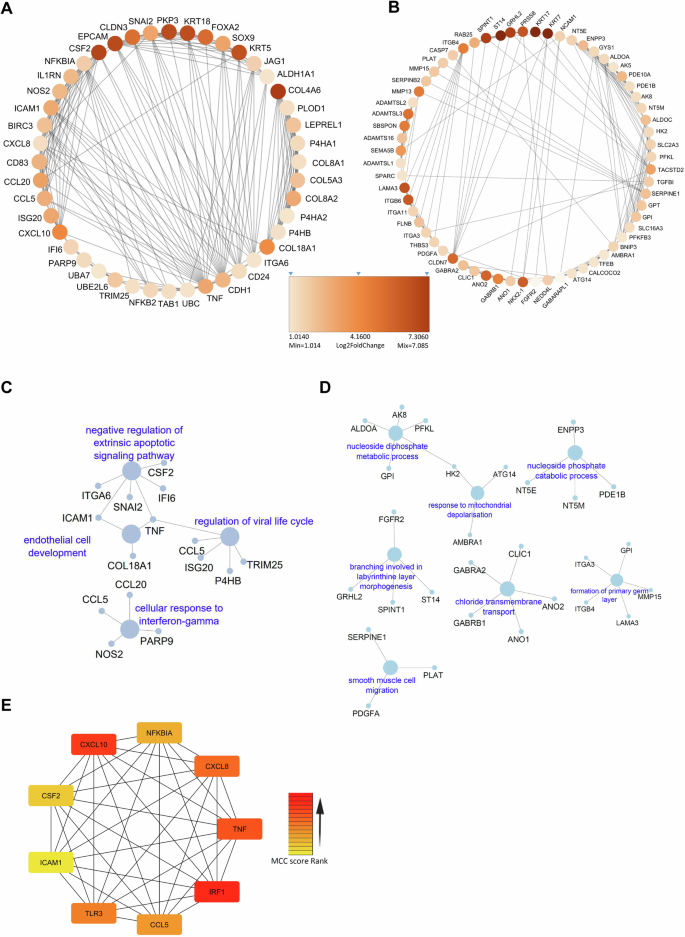
Among 36 up-regulated critical network clusters in the case of the upregulated DEGs following M. tuberculosis infection, the highest MCODE score of 9.9. Among the 47 clusters identified in the case of the downregulated genes, the highest score was 81.3 (Supplementary data 5). Figure 7A, B depict the top two highly interconnected clusters. Functional analysis of these two clusters reveals extrinsic apoptotic signaling pathway, cellular response to IFN-γ, endothelial development, and antiviral response-related pathways in case of the cluster1 (Fig. 7C), and nucleoside diphosphate metabolic process response to mitochondrial depolarization and smooth muscle migration in case of cluster2 were major upregulated networks in case of M. tuberculosis infection (Fig. 7D). Additionally, by using Cytohubba-based analysis of the total upregulated genes following M. tuberculosis infection we identified CXCL8, CXCL10, CCL5, TNF, CSF2, ICAM1, TLR3, IRF1, and NF-kB1A as major upregulated hub genes amongst the complex protein interaction networks (Fig. 7E). Notably, hub genes identified for M. tuberculosis infections are distinct from the BCG group. Hub genes are central to biological mechanisms and represent potential signatures for an ongoing infection or disease state.
Critical networks cluster1 (A) and cluster2 (B) were constructed using MCODE algorithm in Cytoscape. ClueGO based GO of biological process, and immune related pathways in highly interconnected cluster1 (C) and cluster2 (D). E Top relevant Hub genes identified in PPI network of DEGs in PS-M. tb using Cytohubba MCC-based method.
Commonality and divergence of host responses to BCG and M. tuberculosis infection
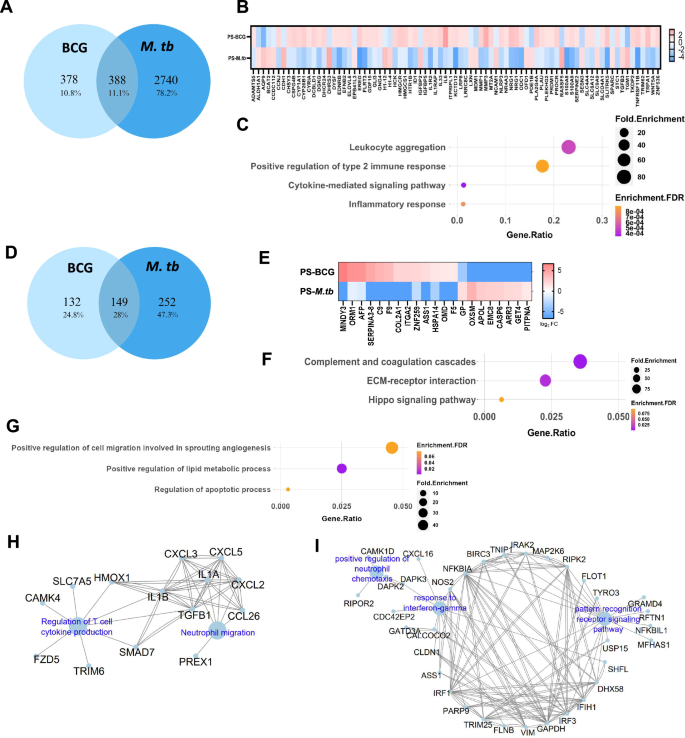
Analysis of the DEGs identifies 388 common genes between BCG and M. tuberculosis groups, of which 307 showed a similar trend of either up or downregulation, and 81 genes exhibited inverse regulation (Fig. 8A). Among the inversely regulated genes, 21 genes were upregulated and 59 were downregulated in M. tuberculosis compared to BCG infection (Fig. 8B). GO analysis of the genes that are upregulated in case of BCG infection identified highly relevant immune response-related biological processes and pathways (leukocyte aggregation, type-2 immune responses, and other cytokine signaling pathways) in case of BCG infection (Fig. 8C). Major genes involved in these immune response pathways were HCK, WNT5A, IL1R2, IL1RAP, IL33, TRIM62, EREG, MT2A, IL6, MMP1, MMP3, LRP8, and TNFRSF11B (Fig. 8B). On the contrary, these genes were significantly downregulated in the case of M. tuberculosis infection indicating the possibility that M. tuberculosis infection subverts certain immune responses in its favor, and limits tissue repair and remodeling process. Notable genes that were significantly upregulated in the case of M. tuberculosis infection but downregulated in the case of BCG infection are RASSF5, CDH1, IGFBP2, TGFB3, and SPARC. Genes such as IGFBP2 and TGFB3 are involved in immune processes, while RASSF5 plays a role in apoptotic pathways, influencing host cell survival. Additionally, CDH1 and SPARC may modulate cell adhesion mechanisms and tissue remodeling processes, potentially impacting M. tuberculosis entry and dissemination within the host.
A Venn diagram of DEGs shows common and unique genes upon BCG and M.tb infection of the pulmospheres. B Heat-map representing inversely regulated differentially expressed genes among common genes upon BCG and M.tb infection of the pulmospheres. C Top GO terms of common up-regulated genes in case of BCG infection and down regulated in M.tb. D Venn diagram of DEPs shows common and unique genes upon BCG and M.tb infection. E Heat-map representing the inversely regulated differentially expressed proteins upon BCG and M.tb infection. F Top GO terms of biological process for inversely regulated proteins that are upregulated in case if M. tuberculosis infection but down regulated in BCG infection. G Top GO terms of biological process up-regulated in case of BCG infection, but down regulated in case M. tuberculosis infection. H Immune network interaction that are up-regulated exclusively following BCG infection. I Immune network interaction upregulated exclusively upon M. tuberculosis infection.
Analysis of the DEPs identifies 149 common proteins between BCG and M. tuberculosis groups (Fig. 8D), of which 128 showed a similar trend of either up or downregulation, and 21 genes exhibited inverse regulation (Fig. 8E). GO analysis on the 21 inversely regulated proteins highlights complement and coagulation cascade pathways, ECM-receptor interaction, and Hippo signaling pathway involving 13 genes as critical signaling pathways that are upregulated in case of M. tuberculosis infection but downregulated in case of BCG infection (Fig. 8F). On the contrary, 8 genes belonging to cell migration and angiogenesis, lipid metabolism, and apoptosis were upregulated in the case of BCG infection, but downregulated in the case M. tuberculosis infection (Fig. 8G).
Analysis of the unique DEGs in the case of BCG infection identifies 233 genes upregulated and 145 genes downregulated (Fig. 8A). ClueGo-based immune responses related pathway analysis of the upregulated genes highlights neutrophil chemotaxis (CXCL3, CXCL2, CXCL5, CCl26, PREX1, IL1A, and IL1B) and regulation of T-cell cytokine production (TGFB, SMAD7, HMOX1, CAMK4, TRIM6, SLC7A5, and FZD5) as the significantly upregulated pathways (Fig. 8H). Whereas, M. tuberculosis infection resulted in 1258 up and 1482 downregulated genes, and ClueGO analysis reveals enrichment of leukocyte activation, differentiation, migration, TLR-3 signaling, and response to IFN-γ pathways among the leading upregulated pathways (Fig. 8I).
Integrated analysis of transcriptome and proteome data identified potential biomarkers for early M. tuberculosis infection in bovines
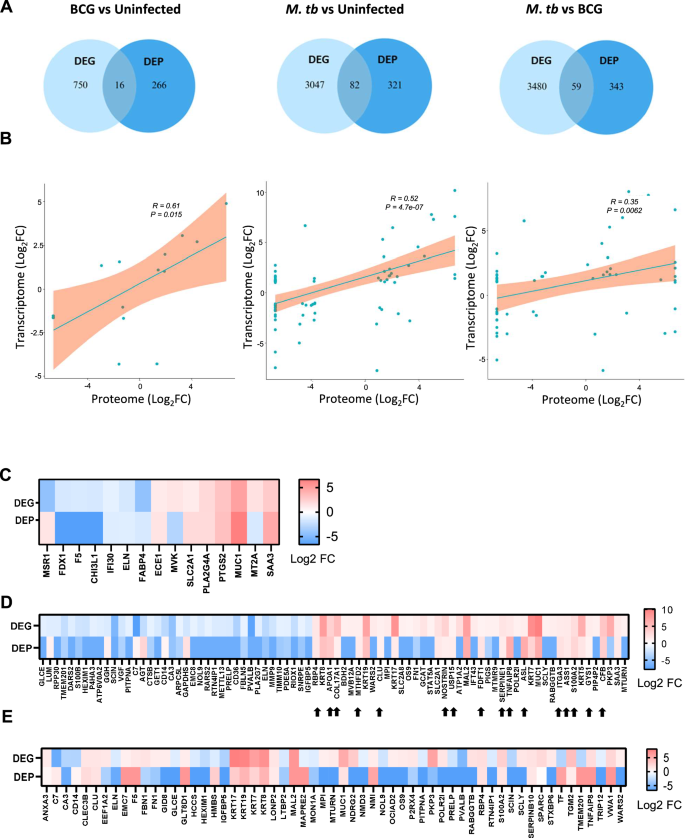
Integration of transcriptomics and proteomics data highlighted key gene/protein expression signatures for M. tuberculosis and M. bovis BCG infection in the bovine pulmospheres. Sixteen genes/proteins in the case of BCG infection, 82 genes/proteins in the case of M. tuberculosis infection, and 59 proteins/genes uniquely expressed in the case of M. tuberculosis infection over BCG infection at both transcriptional and proteomic level (Fig. 9A). Multi-gene correlation analysis reveals statistically significant positive correlation of 0.61 (p = 0.015), 0.52 (p = 4.7e-07), and 0.35 (p = 0.0062), respectively for the genes commonly regulated at both transcriptional and proteomic level (Fig. 9B). Next, by comparing the commonly upregulated genes/proteins from the three conditions discussed above (Fig. 9C–E), we sort-listed 15 genes (COL17A1, CFB, APOA1, S100A2, SERPINE1, RBP4, TNFAIP8, ASS1, ITGA3, GYS1, ASL, MTHFD2, CLU, USP15, FDT1) as unique transcriptomic/proteomic marker of M. tuberculosis infection.
A Venn diagram of DEGs and DEPs shows common and unique genes/proteins upon BCG and M. tuberculosis infection. B Correlation between Log2FC of transcriptome and proteome data for the common genes. P value < 0.05. C Heatmap representing the Log2 FC of DEGs and DEPs upon BCG vs uninfected. D Heatmap representing the Log2 FC of DEGs and DEPs upon M. tuberculosis vs uninfected. E Heatmap representing the Log2 FC of DEGs and DEPs upon M. tuberculosis infection vs BCG infection.
In silico comparative analysis of potential M. tuberculosis infection biomarkers with published omics data
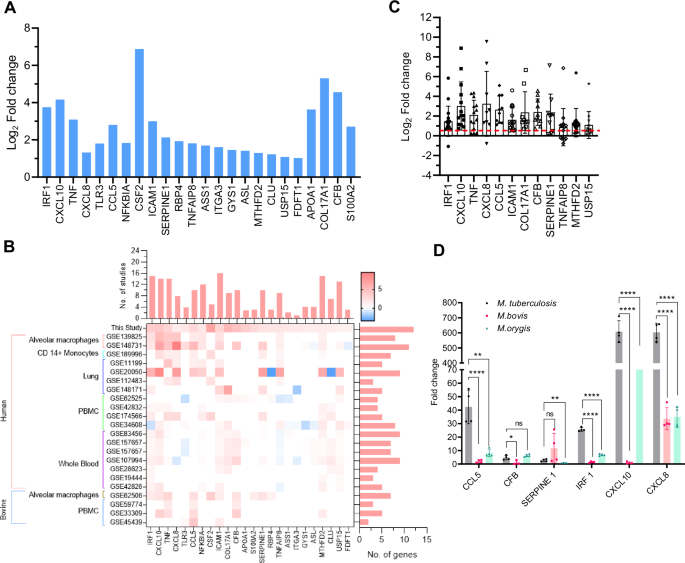
Nine hub genes identified from transcriptome data, and 15 upregulated genes, selected from the integrated analysis were chosen (24 genes) for further analysis for identifying potential markers of M. tuberculosis infection of the bovine lungs (Fig. 10A). These genes/proteins could have significant potential as biomarkers for TB disease diagnosis, treatment monitoring, and the evaluation of vaccine-induced responses. We employed a robust in silico validation protocol to evaluate the cohort of identified genes. This involves a meticulous comparison with publicly available TB-transcriptome datasets (23 independent studies were included). The criteria for the selection of this dataset were described in detail in the materials and method section. Figure 10B illustrates the transcriptional status of selected 24 genes across all the data sets. Remarkably, 12 genes (IRF1, CXCL10, TNF, CXCL8, CCL5, ICAM1, COL17A1, CFB, SERPINE1, TNFAIP8, MTHFD2, and USP15) were found to be represented in more than 50% of the datasets. Finally, using a minimum cut-off Log2 fold induction of 0.585 (>1.5 fold in linear scale), and careful consideration of the nature of the bio-molecules, we shortlisted six genes/protein (IRF1, CXCL8, CXCL10, CCL5, SERPINE1, and CFB) as potential M. tuberculosis early infection biomarker (Fig. 10C).
A Bar diagram illustrates the Log2 fold change of 24 key genes selected in this study. B Heat-map represents the Log2 fold change of the key genes across selected similar omics studies, the bar diagram above the heat-map depicts the number of studies with upregulation of the specific gene, and the bar diagram on the right side of the heat map shows number of genes detected in a selected study. C The dot plot with mean and SD graph represents the Log2 fold change values of each gene across all 23 selected studies. The red dashed line denotes the applied cut-off Log2 fold value of 0.585 (1.5-fold in linear scale). D Comparative gene expression analysis of M. tuberculosis, M. bovis, and M. orygis pulmospheres using Real-Time PCR. Individual data points in the bar graph represent fold gene expression in each biological replicate (n = 4). Data information: Statistical analysis included an unpaired two-tailed t-test for comparison between two. Error bar is mean ± SD, n = 4, *, P < 0.05; **, P < 0.01; ****, P < 0.0001.
Further, considering the relevance of animal lineage MTBC species, such as M. bovis and M. orygis in cattle TB incidences, we evaluated the selected markers using real-time PCR-based gene expression analysis. Pulmospheres were infected with virulent M. bovis AN5, M. orygis NIAB1 strains33, and M. tuberculosis H37Rv. A significant upregulation of majority of the selected genes was observed (>1.5 fold, p > 0.05), with distinct expression patterns across M. tuberculosis, M. bovis, and M. orygis, highlighting pathogen-specific immune responses (Fig. 10D). Notably, the fold upregulation of CCL5 (>40 fold), IRF1 (>25 fold), CXCL10 (>600 fold), and CXCL8 (>600 fold) was significantly higher in M. tuberculosis infection compared to the fold upregulation of these genes in case of animal lineage M. bovis and M. orygis infection. Conversely, CFB, and SERPINE1 show no distinct expression pattern between human, and animal lineage mycobacterial infections, indicating their limited utility as lineage-discriminatory markers. In case of M. bovis infection, only SERPINE1 (>10 fold) and CXCL8 (>30 fold) exhibited moderate upregulation, while other genes exhibited nominal changes. In contrast, M. orygis infection resulted in a markedly higher expression of CCL5 (>8 fold), CFB (>6 fold), IRF1 (>6 fold), CXCL10 (>130 fold), and CXCL8 (>30 fold). These findings suggest that while a core upregulated gene signature is shared across the three MTBC species, the magnitude of host responses varies in a pathogen-specific manner.

