Identification of intersecting genes in Ani HBr and sepsis
Figure 1 outlines the overall workflow of the study. Figure 2 displays the collection of Ani HBr target genes derived from five databases, resulting in a set of 484 Ani HBr-related genes. Using k-means clustering on the PPI network derived from STRING, the 484 genes were grouped into five clusters (Supplementary Figure S1). To ensure the quality of the GSE65682 dataset, a heatmap, volcano plot, and PCA plot were generated (Supplementary Figure S2). We identified 975 differentially expressed genes associated with sepsis and retrieved 3,010 sepsis-related target genes from the GeneCards database. The intersection of these datasets yielded 30 intersecting genes, as depicted in the Venn diagram (Fig. 3A). Figure 3B shows a heatmap comparing the expression levels of these 30 genes among sepsis survivors, non-survivors, and healthy individuals. For example, genes such as FKBP1B, ARG1, and CTSD exhibit elevated expression in sepsis patients compared to healthy controls, whereas genes such as STAT1, PDE4B, and CFD display reduced expression in sepsis. Notably, these differences are consistent across survivors and non-survivors. Figure 3C illustrates the correlation matrix among these 30 genes, highlighting strong positive correlations between ELANE and CTSG, as well as MMP9 and ARG1, which suggests possible co-regulation and functional relatedness. Conversely, AKR1B1 shows strong negative correlations with MAPK14 and TLR8, implying potential antagonistic roles in sepsis pathophysiology.

The overall workflow of the study.

Ani HBr targets were predicted using five databases: Swiss Target Prediction, Super-PRED, PharmMapper, TargetNet, and SEA. The union of the predicted targets from these databases resulted in a total of 484 genes.

Intersection and Expression Analysis of Ani HBr Targets, GeneCards Sepsis Genes, and DEGs (A) Venn diagram of Ani HBr targets (blue), GeneCards–derived sepsis genes (yellow), and DEGs from GSE65682 (green), identifying 30 overlapping genes, including STAT1, PDE4B, and CFD. (B) Heatmap of the 30 intersecting genes across healthy controls (left), non-survivor sepsis patients (middle), and survivor sepsis patients (right); red and green indicate high and low expression, respectively. (C) Pairwise correlation analysis among key genes: each tile represents the correlation between two genes, with red indicating positive correlation and blue indicating negative correlation; color intensity corresponds to the strength of the correlation (e.g., ELANE–CTSG and MMP9–ARG1 show strong positive associations, whereas AKR1B1–MAPK14 and AKR1B1–TLR8 are negatively correlated).
Gene ontology (GO) and KEGG pathway enrichment analysis of intersecting genes
The 30 intersecting genes were subjected to GO and KEGG enrichment analyses. KEGG pathway analysis (Fig. 4) indicate that elevated ELANE expression is associated with pathological activation of pathways such as NETosis, IL-17 signaling, TLR, and TNF, which together perpetuate a “inflammation-damage-reinflammation” vicious cycle in sepsis. This cycle significantly increases mortality risk. In contrast, low CCL5 expression correlates with inhibition of chemokine signaling, impaired Th1 differentiation, and metabolic defects such as purine metabolism, nucleotide metabolism and folate biosynthesis. Downregulation of these pathways contributes to failed immune cell recruitment (due to insufficient CCL5) and persistent immune suppression (due to T-cell and NK cell dysfunction). GO biological process (GO-BP) analysis (Fig. 5A) highlighted responses to lipopolysaccharide and bacterial-derived molecules, while GO cellular component (GO-CC) analysis (Fig. 5B) indicated enrichment in processes related to ribonucleotide metabolism. GO molecular function (GO-MF) analysis (Fig. 5C) showed associations with specific granules. Collectively, these pathways regulate immune responses, inflammation, and cellular responses to pathogens (e.g., bacteria and viruses) and encompass both innate (e.g., TLR signaling, NOD-like receptor signaling, leukocyte migration, and chemotaxis) and adaptive immune mechanisms (e.g., T cell differentiation, PD-1/PD-L1 pathway), in addition to processes related to organelle function, metabolism, and extracellular matrix remodeling. Together, these biological processes underpin the body’s defense against pathogens while playing crucial roles in inflammation, immune regulation, and tissue repair.

KEGG pathway enrichment analysis of the 30 intersecting genes, with red bars representing upregulated genes and green bars representing downregulated genes.

(A–C) GO enrichment analysis of the 30 intersecting genes across Biological Processes (BP), Cellular Components (CC), and Molecular Functions (MF), respectively, depicted as dot plots where each dot represents a gene.
PPI analysis for identifying key genes related to Ani HBr and sepsis
The protein–protein interaction (PPI) network constructed using the STRING database (interaction score > 0.7) comprised 19 nodes and 21 edges (Supplementary Figure S3); 11 genes did not interact with others. Using the Cytoscape CytoHubba plug-in with the MCC algorithm, the top seven hub genes—CCL5, LCN2, CTSG, MMP9, MMP8, ELANE and STAT1—were identified (Fig. 6).

Identification of key genes using the CytoHubba plugin, resulting in the selection of 7 hub genes.
Machine learning for identifying key genes related to Ani HBr and sepsis
To identify key genes influencing 28-day survival, we selected 479 sepsis patients and divided them into training and validation cohorts based on the 30 intersecting genes. In the training cohort, 117 algorithm combinations were fitted using the “Mime” R package to construct a prognostic model, and the average C-index was calculated for each algorithm in internal validation (Supplementary Fig. S4). When C-index values were similar, models with fewer hub genes were preferred. As a result, the StepCox[forward] + RSF combination was selected as the final model, achieving a C-index of 0.95 in the training set and 0.7 in the validation set, both demonstrating good calibration (Fig. 7). Figure 8A illustrates the trend of the out-of-bag (OOB) error rate, which stabilizes when ntree > 1000. Figure 8B ranks the importance of the seven genes selected by StepCox[forward] + RSF, with FKBP1B, ELANE, and CCL5 identified as the top three. The model was then used to predict 7-day, 14-day, and 28-day mortality in the validation cohort, with AUC values of 0.737, 0.734, and 0.72, respectively (Supplementary Fig. S5). Figure 9 provides a time-dependent interpretation of the selected genes. Figure 9A presents a local explanation for a specific patient, showing the daily influence of the seven genes on 28-day survival predictions since admission. We utilized the SurvLIME explanation method to analyze key feature importance and model predictive capabilities. Figure 9B combines model interpretability analysis of one patient subset. The left panel displays local feature importance derived from SurvLIME, while the right panel compares the survival functions of the black-box model and the SurvLIME explanation model. ARG1, CCL5, and LCK exhibit the highest local importance. ARG1 positively influences survival probability (green bars), whereas CCL5 and LCK show negative impacts (red bars), suggesting potential associations with adverse outcomes. The black-box model (blue line) predicts higher survival probabilities, indicating its advantage in capturing complex nonlinear relationships. The SurvLIME explanation model (green line) predicts slightly lower survival probabilities but follows a similar trend, demonstrating that SurvLIME effectively captures key influencing factors and validates the reliability of feature importance. Figure 10 illustrates the time-dependent feature importance within the model. Feature importance is defined as “1 minus the C/D AUC loss,” reflecting each feature’s contribution to the model’s predictive performance across different time points. CCL5 consistently emerges as the most important feature, with its importance slightly increasing over time. This suggests its pivotal role in the model and potential relevance to inflammatory response and immune regulation. FKBP1B, LCK, ARG1 and ELANE also exhibit high and relatively stable importance, indicating sustained influence on survival predictions. Supplementary Figure S6 presents the model’s predictive performance over time, assessed using the Brier Score and C/D AUC metrics. The Brier Score is low in the early time periods and increases in later stages but still lower than 0.5, indicating high predictive accuracy. The model’s C/D AUC approaches 1 initially, reflecting excellent discriminative capacity. Although it decreases slightly over time, it stabilizes around 0.91, maintaining strong discriminative performance. These findings provide robust data support for the model’s reliability and interpretability, demonstrating the effectiveness of machine learning approaches in survival analysis.

Concordance index (C-index) of the StepCox[forward] + RSF model in the training (blue) and validation (green) cohorts, showing C-indices of 0.95 and 0.70, respectively, with calibration indicating good model performance.

Error Rate and Feature Importance of the StepCox[forward] + RSF Model (A) Out-of-bag error rate across 3,000 trees in the validation cohort, with a minimum error of 0.30. (B) Importance ranking of the seven selected genes—FKBP1B, ELANE, CCL5, ARG1, LCK, DCUN1D1, and CTSG—where higher scores indicate greater contribution to model performance.

Local Explanation of the StepCox[forward] + RSF Model (A) Local feature contributions for a representative patient, showing each gene’s positive (green) or negative (red) impact on predicted 28-day mortality; ARG1 has the strongest positive effect, while CCL5 and LCK exert negative effects. (B) Comparison of the “black-box” RSF survival curve (blue) with the SurvLIME‐explained survival function (green), both starting at 1.00 and declining over time, demonstrating that SurvLIME closely approximates the model’s predictions.

Global, Time‐Dependent Feature Importance of the StepCox[forward] + RSF Model Lines represent each gene’s importance over time, measured by changes in dynamic AUC loss. CCL5 consistently shows the highest importance at all time points, with its influence increasing over the course of prediction. FKBP1B, LCK, ARG1, and ELANE also maintain high and stable importance, indicating their sustained contributions to survival risk estimation.
Identification of prognostic genes related to Ani HBr and sepsis (PGRAS) and construction of a risk score model
The intersection of the seven machine learning-selected genes with the seven hub genes yielded three key prognostic genes (Fig. 11A). Correlation analysis (Fig. 11B) revealed a strong positive correlation between ELANE and CTSG. Based on median expression levels, each gene was categorized into high- and low-expression groups. Univariate Cox regression analysis (Supplementary Fig. S7) confirmed the prognostic significance of these genes, and Kaplan–Meier survival analyses demonstrated significant survival differences between high- and low-expression groups (Supplementary Fig. S8). Through multivariate Cox regression(Supplementary Fig. S9) with stepwise selection (p < 0.05), ELANE (p < 0.001, HR = 1.176) and CCL5 (p = 0.011, HR = 0.810) were identified as the final prognostic genes. A risk score (RS) was computed based on their expression and coefficients, stratifying patients into high- and low-risk groups (Fig. 12). Consistent with the hazard ratios, high-risk patients exhibited elevated ELANE and reduced CCL5 expression, and these patients had significantly worse survival outcomes (Fig. 13). Cox regression confirmed RS as an independent prognostic factor, with the prognostic model showing AUC values of 0.64, 0.65, and 0.64 for 7-, 14-, and 28-day ROC curves, respectively (Supplementary Fig. S10). Additionally, RS and patient age were independently associated with overall survival (OS) in multivariate analysis(Supplementary Fig. S11), and these factors were incorporated into a nomogram for predicting 7-, 14-, and 28-day OS (Supplementary Fig. S12).

(A) Venn diagram illustrating the intersection of genes identified through protein–protein interaction (PPI) network analysis and machine learning prognostic models, resulting in four key genes. (B) Correlation analysis among the 3 key genes.

Prognostic Risk Stratification by Key Genes (A) Individual risk scores ranked from lowest to highest; median cutoff (dashed line) separates low-risk (blue) and high-risk (red) groups. (B) Patient survival status versus risk score: blue dots indicate survivors, red dots indicate non-survivors, with a higher mortality rate in the high-risk group. (C) Expression of ELANE and CCL5 in low- versus high-risk groups, showing low-risk patients have low ELANE and high CCL5, whereas high-risk patients exhibit the opposite pattern.

Kaplan–Meier curve demonstrating the impact of the risk index on 28-day survival.
Landscape of immune infiltration of PGRAS
CIBERSORT with the LM22 signature was applied to deconvolve 22 immune cell subsets from GSE65682 bulk expression data (Supplementary Figure S13). Patients were stratified into high- and low-risk groups by ELANE/CCL5 risk score, retaining samples with P < 0.05 (Fig. 14). Two-sample t-tests (α = 0.05) revealed significant enrichment of regulatory T cells (Tregs; p = 0.02) and monocytes (p = 0.032) in the high-risk cohort (Supplementary Figure S14). This pattern suggests compensatory monocyte recruitment coupled with Treg‐mediated immunosuppression and a shift toward reparative (M2-like) monocyte phenotypes.

Differential Immune Cell Infiltration Between Risk Groups Boxplots comparing the proportions of 22 immune cell subsets in high- (red) versus low-risk (blue) patients. “*” indicates P < 0.05; “ns” denotes no significant difference.
Landscape of immune checkpoints of PGRAS
Expression of 29 differentially expressed immune checkpoints was compared between high- and low-risk sepsis patients (Fig. 15A). In the low-risk group, most checkpoints—including TMIGD2, ICOS, PDCD1, TNFSF14, TNFRSF9/14/25, CD27/28/70, CD86, IDO1, LAG3, NCR3, and TIGIT—were upregulated, indicating a robust anti-pathogen response with potential T cell exhaustion. In contrast, ENTPD1 and LAIR1 levels were elevated in the high-risk group, consistent with enhanced immunosuppression. The risk score (RS) exhibited significant negative correlations with the majority of checkpoints (e.g., CD27/28/70, PDCD1, TIGIT, LAG3) and positive correlations with ENTPD1 and LAIR1 (Fig. 15B). Focusing on ELANE and CCL5 (Fig. 16), ELANE expression demonstrated inverse associations with CD160, CD274, CD44/48, HAVCR2, ICOS, IDO1, TIGIT, and various TNFRSF/TNFSF members, while correlating positively with CD27, suggesting a pro-inflammatory bias via downregulation of inhibitory pathways and upregulation of co-stimulatory signaling. Conversely, CCL5 displayed bidirectional correlations—positive with CD160, CD27/28/70, ICOS, LAG3, NCR3, PDCD1/PDCD1LG2, TIGIT, TMIGD2, TNFRSF9/14/25, and TNFSF14, and negative with CD274, CD44/48, ENTPD1, HAVCR2, and LAIR1—reflecting its dual role in promoting effector cell recruitment while modulating specific immunosuppressive checkpoints. These distinct correlation patterns underscore ELANE’s and CCL5’s unique contributions to the sepsis immune checkpoint milieu and highlight potential avenues for targeted immunomodulation.

Differences and Correlations Between Risk Score and Immune Checkpoint Genes. (A) Differential expression of 29 immune checkpoint genes between high- and low-risk groups. (B) Correlation between the risk score and each of the 29 immune checkpoint genes. Each rectangle represents the correlation strength (r) and significance (− log10 p). p < 0.05 (), < 0.01 (), < 0.001 (), < 0.0001 (****).

Correlation Between ELANE/CCL5 Expression and Immune Checkpoint Genes. Heatmaps show the correlations between ELANE or CCL5 expression and 29 immune checkpoint genes. Each rectangle represents the correlation coefficient (r) and statistical significance (− log10 p). p < 0.05 (*), p < 0.001 (**).
Molecular docking analysis
For ELANE, the best-scoring pose exhibited a binding energy of –6.1 kcal/mol. In this complex, Ani HBr’s aromatic ring engages in a π–π stacking interaction with PHE192, while its tropane moiety packs against VAL216 through π–alkyl contacts. A network of van der Waals interactions stabilizes the ligand in the active‐site cleft, involving residues PHE215, SER214, VAL62, PHE41, LEU99 and CYS58 (Fig. 17A). No direct hydrogen bonds were observed, suggesting that hydrophobic and aromatic contacts dominate Ani HBr’s association with ELANE.

Molecular docking results. (A) Molecular docking analysis reveals a binding affinity of –6.1 kcal·mol⁻1 between Ani HBr and ELANE. (B) Molecular docking analysis reveals a binding affinity of –7.6 kcal·mol⁻1 between Ani HBr and CCL5.
Docking against the CCL5 oligomer produced an even stronger predicted affinity (–7.6 kcal/mol). Here, Ani HBr forms a key hydrogen bond between its ester oxygen and the side‐chain hydroxyl of THR7. A π-cation interaction with LYS33 further anchors the ligand, complemented by hydrophobic contacts from LYS33’s aliphatic chain. Additional van der Waals interactions involve PRO9, PHE12, ALA13, SER5, SER31 and GLY32 (Fig. 17B). This constellation of polar and nonpolar contacts likely underlies the enhanced stability and tighter binding of Ani HBr to CCL5 compared with ELANE.
Together, these docking results identify critical residues that mediate Ani HBr’s interactions with two key nodes of the ELANE/CCL5 axis. The differential binding affinities and interaction profiles provide a structural rationale for Ani HBr’s dual modulation of NETosis and chemokine signaling in sepsis.
Molecular dynamics simulations
To assess the stability and dynamics of the Ani HBr–ELANE (5ABW) and Ani HBr–CCL5 (5CMD) complexes, we carried out 100 ns MD simulations in the NPT ensemble at 310 K and 1 bar. The root‐mean‐square deviation (RMSD) of the protein‐ligand backbone atoms provides a measure of complex equilibration and stability (Fig. 18A). The 5CMD–Ani HBr complex equilibrated between 5 and 35 ns, oscillating around 0.25 nm, before gradually rising after 35 ns—indicative of a slight expansion of the binding interface. In contrast, the 5ABW–Ani HBr complex reached equilibrium within the first 5 ns and thereafter fluctuated by only ± 0.10 nm around an average RMSD of ~ 0.10 nm, demonstrating markedly higher conformational stability. The radius of gyration (Rg) tracks the overall compactness of each complex (Fig. 18B). The 5CMD–Ani HBr system maintained a stable Rg (~ 1.8 nm) until ≈40 ns, after which it gradually increased to ~ 1.9 nm, reflecting a modest loosening of the complex. By contrast, the 5ABW–Ani HBr complex exhibited minimal Rg fluctuations (~ 1.7 nm throughout), confirming that the Ani HBr–ELANE binding pocket remains tightly packed. Solvent‐accessible surface area (SASA) calculations (Fig. 18C) showed that both complexes experienced only slight SASA fluctuations before settling into stable plateaus. This behavior suggests that Ani HBr binding induces minor adjustments in the local hydration shell but does not cause large‐scale exposure or burial of surface residues. Hydrogen bonds between Ani HBr and its targets were monitored over the trajectory (Fig. 18D). The 5CMD complex formed between 0 and 6 H-bonds at any given time, averaging ~ 2 persistent hydrogen bonds. Similarly, the 5ABW complex maintained 0–5 H-bonds, also centering around ~ 2. These results indicate robust hydrogen‐bond networks that contribute to ligand retention. Root‐mean‐square fluctuation (RMSF) profiles quantify per‐residue flexibility (Fig. 19). In the 5ABW–Ani HBr complex, most residues exhibited RMSF values below 0.3 nm, indicating low flexibility and a rigid binding interface. The 5CMD–Ani HBr complex showed higher RMSF peaks (up to 1.0 nm) at several loop and surface regions, consistent with the greater overall mobility observed in RMSD and Rg analyses. Using the gmx_MMPBSA tool, we estimated the binding free energies of each complex (Fig. 20A). The 5ABW–Ani HBr complex exhibited a ΔG_bind of –13.29 kJ/mol, whereas the 5CMD–Ani HBr complex showed a ΔG_bind of –1.28 kJ/mol. These negative values confirm favorable and spontaneous binding, with the Ani HBr–CCL5 interaction predicted to be particularly strong. Per‐residue energy decomposition (Fig. 20B,C) identified SER214, HIS57, PHE192, and SER195 as the major contributors to ELANE binding, and THR7, THR8, PRO9, and LYS33 as key drivers of CCL5 association. Importantly, at the end of the 100 ns simulation Ani HBr remains lodged at the 5CMD dimer interface, forming a hydrophobic contact with ALA9 on chain A and establishing hydrogen bonds with THR3 and THR4 on chain B, and with ASP2 and ASP31 on chain C (Fig. 20D).

(A) RMSD (root-mean-square deviation) curves indicate backbone stability over time: the black line represents ELANE–Ani HBr, and the red line represents CCL5–Ani HBr. (B) Radius of gyration (Rg) profiles over 100 ns showing that the 5CMD–Ani HBr complex remains compact until ~ 35 ns before a modest expansion, whereas the 5ABW–Ani HBr complex maintains a consistently stable and tighter conformation throughout. (C) SASA profiles over 100 ns reveal only minor fluctuations for both complexes, stabilizing into plateaus, while Rg data show the 5CMD–Ani HBr complex loosens slightly after ~ 40 ns and the 5ABW–Ani HBr complex remains consistently compact. (D) Time‐resolved hydrogen‐bond counts showing both complexes sustain an average of ~ 2 H-bonds over 100 ns (0–6 for 5CMD–Ani HBr, 0–5 for 5ABW–Ani HBr).
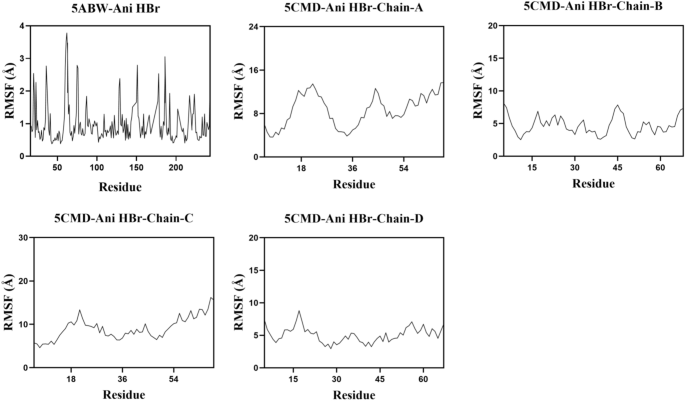
RMSF plots indicating low residue flexibility (< 0.3 nm) in the 5ABW–Ani HBr complex versus larger fluctuations (up to 1.0 nm) in loop and surface regions of the 5CMD–Ani HBr complex.

(A) MM-PBSA binding free energies for Ani HBr–ELANE and Ani HBr–CCL5 complexes, showing ΔG_bind values of –13.29 kJ/mol and –1.28 kJ/mol, respectively. (B,C) Per-residue energy decomposition identifying key contributors: SER214, HIS57, PHE192, and SER195 for ELANE (5ABW), and THR7, THR8, PRO9, and LYS33 for CCL5 (5CMD). (D) End-frame view of Ani HBr (orange sticks) at the 5CMD dimer interface. ALA9 (chain A) makes a hydrophobic contact (grey dashed line), and hydrogen bonds (blue dashed lines) form with THR3/THR4 (chain B) and ASP2/ASP31 (chain C).
Overall, the MD simulations corroborate that Ani HBr forms stable, energetically favorable complexes with both ELANE and CCL5. The exceptional rigidity and low RMSD/Rg of the Ani HBr–ELANE complex, together with its favorable ΔG_bind and key interacting residues, support a mechanistic role for Ani HBr in inhibiting ELANE‐mediated NETosis. Concurrently, the strong binding to CCL5 underscores its potential to modulate chemokine signaling in sepsis. These insights lay a molecular foundation for Ani HBr’s dual targeting of the ELANE/CCL5 axis in precision sepsis therapy.
Single-cell transcriptomic analysis of the ELANE/CCL5 axis
Cell-type annotation and differential expression
Using CellTypist with a pretrained immune reference model, we annotated clustered cells from GSE175453 into major myeloid and lymphoid lineages (Fig. 21). A majority-voting refinement step based on canonical markers (ELANE/MPO for neutrophils; CD14/CD16 for monocytes; CD3D/E for T cells; NKG7 for NK cells; MS4A1 for B cells) yielded five myeloid subsets (classical monocytes, non-classical monocytes, DC2, pDC, neutrophils), four lymphoid subsets (Tem/effector helper T, Tcm/naïve cytotoxic T, MAIT, CD16⁺ NK), and minor populations (megakaryocytes/platelets, plasmablasts, late erythroid cells). To assess the impact of Ani HBr–related targets across cell types, we performed Wilcoxon rank-sum tests on 30 intersection genes. ELANE was markedly upregulated in sepsis neutrophils (p < 0.001; Fig. 22), consistent with its role in NET formation and pro-inflammatory activation. In contrast, CCL5 expression was elevated across multiple lymphoid subsets—particularly Tem/Temra cytotoxic T cells, CD16⁺ NK cells, and megakaryocytes/platelets—highlighting its chemotactic function (Fig. 22).

UMAP Projection and Cell-Type Annotation. UMAP projection of single-cell RNA-seq data showing cluster distributions of major immune cell types and subpopulations. Cells were annotated using a majority-voting strategy: each cell received multiple candidate labels which were consolidated via standardized nomenclature and statistical consensus. Final classification identified five myeloid subsets—Classical Monocytes, Non-classical Monocytes, DC2 (type 2 dendritic cells), pDC (plasmacytoid dendritic cells), and Neutrophils—four lymphoid subsets—Tem/Effector Helper T cells, Tcm/Naïve Cytotoxic T cells, MAIT (mucosal-associated invariant T cells), and CD16⁺ NK cells—and additional populations including Megakaryocytes/Platelets, Plasmablasts, and Late Erythroid cells.

Differential Expression of Ani HBr–Associated Genes Across Cell Types. Wilcoxon rank-sum tests were performed on 30 genes intersecting Ani HBr targets and sepsis biomarkers to compare expression across annotated cell populations. ELANE is significantly upregulated in neutrophils from sepsis patients, consistent with its pro-inflammatory role and involvement in NET formation. In contrast, CCL5 shows broad upregulation across multiple lineages—including Tem/Temra cytotoxic T cells, CD16⁺ NK cells, and megakaryocyte/platelet clusters—highlighting its central function in chemotactic recruitment. Dot size represents the percentage of cells within each group expressing the gene, and dot color intensity (red) indicates mean expression level.
ELANE and CCL5 expression by clinical subgroup
Comparative analysis among healthy controls, RAP, and CCI patients revealed subgroup-specific patterns. ELANE expression was minimal in controls and RAP (Fig. 23A,B) but significantly enriched in CCI neutrophils (Fig. 23C), indicating exaggerated neutrophil activation in chronic critical illness. Conversely, CCL5 was constitutively expressed in CD16⁺ NK, cytotoxic T, and megakaryocyte/platelet clusters in controls and RAP (Fig. 24A,B), but CCI samples exhibited additional upregulation in MAIT and plasmablast populations (Fig. 24C), suggesting amplified chemokine-driven recruitment in severe sepsis.

ELANE Expression Across Cell Types. (A) Healthy controls; (B) rapidly recovering (RAP) patients; (C) chronic critical illness (CCI) patients. Color scale indicates normalized ELANE expression, with blue denoting low and red denoting high expression.

CCL5 Expression Across Cell Types. (A) Healthy controls; (B) rapidly recovering (RAP) patients; (C) chronic critical illness (CCI) patients. Color scale indicates normalized CCL5 expression, with blue denoting low and red denoting high expression.
Pseudotime trajectory analysis
Monocle 3–based pseudotime reconstruction delineated distinct differentiation trajectories in RAP and CCI. In RAP patients, cells progressed from classical monocytes → DC2/pDC → megakaryocyte/platelet → plasmablast/non-classical monocytes → Tem/effector helper T → CD16⁺ NK cells (Fig. 25), with branch probabilities reflecting early innate-immune predominance, mid-stage adaptive-immune engagement, and late regulatory T/NK enrichment (Fig. 26). Notably, CCL5 expression persisted throughout these transitions, suggesting a bridging role between inflammatory and regulatory phases. In CCI patients, trajectories originated from monocytes/HSC-like/megakaryocyte clusters, passed through DC2/pDC, bifurcated into T/NK lineages, and culminated in B-cell states (Fig. 27). Plasma cells and pDCs exhibited the highest lineage commitment, while time-resolved probabilities showed an early bias toward innate lineages, mid-stage T/NK/plasma differentiation, and late B-cell expansion (Fig. 28). ELANE peaked in early myeloid branches, whereas CCL5 remained elevated in megakaryocyte/platelet, Tem/Trm cytotoxic T, and NK clusters, reinforcing an ELANE → CCL5 regulatory axis that may underlie chronic inflammation in CCI.

Pseudotime Trajectory Analysis in RAP Patients. Pseudotime and entropy metrics reveal dynamic state transitions among immune cell types during sepsis in a rapid recovery patient (RAP). (A) tSNE plot of immune cells from a rapid recovery patient (RAP), annotated by major cell types using the majority-votingmethod. (B,C) Cells originate from classical monocytes (Classical Mono), progress through DC2 and plasmacytoid dendritic cells (pDC), then differentiate into megakaryocytes/platelets, plasmablasts, and non-classical monocytes, before transitioning into T-cell populations and ultimately CD16⁺ NK cells. (D–M) Ten subpanels depict the probability distributions for each cell’s commitment to the ten terminal states, confirming the logical consistency between the designated root population and terminal differentiation outcomes. Pseudotime: inferred progression order; Entropy: measure of cell-state diversity.

Dynamic Differentiation Probabilities in RAP Patient Along Pseudotime. Fate probability represents the predicted likelihood of each cell to differentiate into a given terminal subcluster, with higher values indicating stronger commitment. “Selected Cells” highlights the target lineage, contrasted against “Other Cells” to emphasize lineage specificity. Panels A–M depict how differentiation probabilities evolve over pseudotime: during the early phase (D,F,H), cells primarily commit to monocytes and megakaryocytes/platelets, reflecting innate immune dominance; in the mid phase (A,E), commitment shifts toward Tem/effector helper T cells and CD16⁺ NK cells, indicating adaptive immune engagement; and in the late phase (B,J), Tem/Trm cytotoxic T cells and Tcm/naïve helper T cells predominate, signifying the transition to regulatory and reparative states. Notably, CCL5 expression remains enriched in megakaryocytes/platelets, Tem/Trm cytotoxic T cells, and CD16⁺ NK cells throughout pseudotime, suggesting a sustained chemokine-mediated bridge between inflammatory activation and immune regulation.

Pseudotime Trajectory Analysis in CCI Patients. Pseudotime and entropy metrics reveal dynamic state transitions among immune cell types in a chronic critical illness (CCI) patient. (A) tSNE plot of immune cells from chronic critical illness (CCI) patients, annotated by major cell types using the majorityvotingmethod. (B,C) Trajectory origin is traced to classical monocytes, HSC/MPP, and megakaryocyte/platelet clusters, followed sequentially by DC2 and plasmacytoid dendritic cells (pDC), entry into T-cell lineages, differentiation into CD16⁺ NK cells, and eventual maturation into B-cell populations. (D–V) Panels display probability‐based lineage paths from the root to each of the 19 terminal states, with bar plots on the right of each panel indicating fate probabilities. Plasma cells and pDCs exhibit the highest differentiation probabilities (> 0.8), highlighting their dominant roles in immune regulation during CCI.

Temporal Differentiation Probabilities in a CCI Patient. Fate probability denotes the predicted likelihood of each cell differentiating into a given terminal subcluster (higher values indicate stronger commitment). “Selected Cells” highlights the target lineage versus “Other Cells.” Across pseudotime, early stages (panels (O, J, E, S, G, L)) show predominant differentiation into monocytes, megakaryocytes/platelets, DC2, pDC, and neutrophils—reflecting a hyperinflammatory response. Mid stages (panels (B, C, F, K, M, N, P)) reveal a shift toward T-cell populations, plasma cells, and CD16⁺ NK cells, indicating a transition from inflammation to repair. Late stages (panels (H, Q)) are characterized by increased B-cell differentiation, marking the onset of antibody-mediated adaptive immunity. Notably, CCL5 expression remains enriched in megakaryocyte/platelet, Tem/Trm cytotoxic T, and CD16⁺ NK clusters throughout, consistent with our model in which Ani HBr sequentially targets ELANE followed by CCL5 to dampen excessive inflammation and promote immune homeostasis.


