Study area
Our study focused on Blantyre district. The district has 39 government-operated health facilities, with 16 in the city and 23 in rural areas. These health facilities served as key operational hubs for engaging with HSAs and planning our field mapping activities (Fig. 2). It is worth noting that in rural Blantyre, the population is sparsely distributed, with residential areas typically surrounded by farmland. Western Blantyre, in particular, has the lowest population density, and health facilities are more widely spread compared to other parts of the district. While this distribution may result in some underrepresentation of residential areas in western Blantyre, we mitigated this limitation by analyzing patient records from health facilities bordering western Blantyre that serve these communities, allowing us to capture residential areas whose residents seek healthcare outside district boundaries. Additionally, we consulted community leaders and village heads from western Blantyre to validate and supplement our residential area listings.

Map of the study area showing Blantyre city/urban within Blantyre district and the distribution of health centres to which patients report for care. Inset: Map of Malawi showing the location of Blantyre district.
Data collection and integration
To establish a comprehensive list of residential area names, we compiled data from three primary sources namely, locations from recorded cholera cases, malaria cases and official names or residential areas gazetted by the government of Malawi. Cholera records formed our primary dataset given the recent outbreak. First, we obtained cholera line listing (example depicted in Fig. 3) from Blantyre District Health Office (DHO)26. We also included names of residential areas obtained from malaria records27. Malaria is an endemic disease in Malawi, and it is one of the most comprehensively documented diseases in local health facilities, providing additional residential area names that might not appear in cholera records. Furthermore, we collected gazetted names from Blantyre DHO, which are official residential area names listed by district councils in Malawi28. These datasets were combined using R Statistical Software version 4.3.125 to create a unified database of names of residential areas in Blantyre district. As such, our consolidated dataset had a list of names of residential areas.
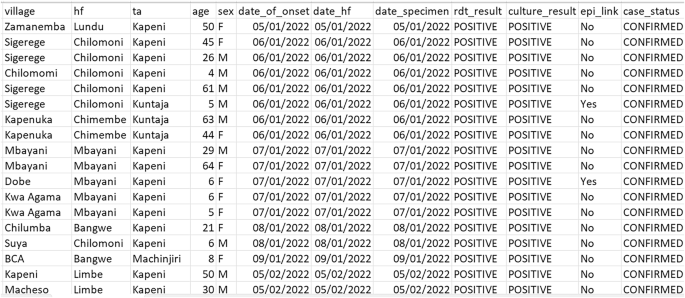
Sample snapshot of cholera records used for geolocating residential areas of cholera patients. The dataset includes patient identifiers (anonymized), reporting dates (onset of symptoms, health facility visit, and specimen collection), residential locations, and clinical details that informed our geolocation process. Patient identifiers have been obscured to protect privacy.
Participatory mapping approach
We adopted a participatory mapping approach, an approach that recognizes the value of local knowledge and aims to collaborate with community members to contribute their unique expertise to the mapping process with the support of governmental institutions, non-governmental organizations (NGOs) or academic institutions29,30. We conducted five meetings with authorities from Blantyre DHO and MLW to encourage participation and ownership in the mapping process. These meetings facilitated discussions on the approach and goals of mapping.
We recruited and trained five data collectors: two research assistants from MLW and three Youth Mappers each from Malawi University of Business and Applied Sciences, University of Malawi and Malawi University of Science and Technology. Youth Mappers are a global community of independent university student groups that find common ground in their use of geospatial tools and platforms31. Through collaboration, they tackle authentic community challenges and empower positive change. We advertised the call for volunteer mappers through a WhatsApp group created for Malawi OpenStreetMap Community (details of this community can be accessed elsewhere32). These Mappers were selected based on their interest and enthusiasm for the project. The two research assistants were engaged based on their interest in the project and their high proficiency in the use of KOBO Toolbox. We organized a one-day training session, covering introduction to KoBo Toolbox, data collection methodologies, process of capturing geographical coordinate, and troubleshooting technical issues in the field.
We engaged HSAs to provide local knowledge and guidance within their working catchment areas. HSAs are community-based health workers who serve as contact points between the health system and communities in Malawi. They live and work within their assigned communities, conducting health surveillance, providing basic health services, and maintaining detailed knowledge of their catchment areas33. Their deep understanding of local geography, community structures, and residential patterns made them invaluable resources for this mapping exercise, as they could accurately identify and validate location names and boundaries that might not be apparent to outside observers.
Our data collection process began with preliminary preparation, where residential area names were printed and distributed to data collectors for planning purposes. We then created an online survey using KOBO Collect Toolbox (https://www.kobotoolbox.org/)34, deployable offline on smartphones. The survey captured data collector’s identity, associated health facility, residential area name, and geo-point coordinates of residential areas. We used the KoBoToolbox dashboard for real-time monitoring of progress, with access restricted to authorized personnel. Daily reviews of collected data were performed to identify and rectify errors and inconsistencies. We also implemented a feedback mechanism allowing data collectors to report issues, ask questions, and seek clarification to improve the data collection process.
The participatory mapping approach involved collaboration between data collectors, HSAs, motorcycle operators, Blantyre DHO, and MLW. Data collectors were responsible for gathering and recording spatial data on residential areas, HSAs guided data collectors to ensure comprehensive coverage, motorcycle operators and MLW provided transportation and logistical support enabling efficient data collection across a wider area, Blantyre DHO provided cholera line listing, gazetted residential areas and coordination with the HSAs. Figure 4 shows respective teams taking specific roles in ensuring efficient data collection across the district. This method aligns with recommendations from the United Nations Millennium Development Goals (MDGs) and the World Summit on the Information Society35.

(A) Motorcycle operator, (B) Geospatial scientists monitoring and analysing collected data in real-time using the KoBoToolbox dashboard, and (C) data collector crossing a local river in Blantyre district.
Data processing and validation
The mapping process resulted in a dataset containing latitude and longitude coordinates for 764 residential areas, with coordinates typically captured at an identifiable landmark within each residential area. These landmarks included community gathering points (e.g., village chiefs’ residences, community halls, marketplace centers), infrastructure features (e.g., health posts, communal water points), notable physical landmarks (e.g., distinctive rock formations), or central road junctions within the residential area. This data collection was conducted from July 3 to July 24, 2023, spanning 15 working days. Our data validation process ensured GPS precision of <5 meters for each coordinate and linked each coordinate to a specific data collector for traceability. We implemented data integrity constraints in the KoBo collect survey design and conducted visual assessment of collected geo-points using the KoBo Toolbox map element. Validation meetings were held with Blantyre DHO to verify mapped locations.
To ensure high geolocation accuracy, we implemented a comprehensive validation strategy. Beyond the technical precision of <5 meters provided by our GPS-enabled devices, we conducted a systematic accuracy assessment through multiple methods. First, we performed satellite imagery validation by comparing our collected coordinates against high-resolution imagery from Google Earth, evaluating consistency with visible settlement patterns and landmarks. Second, we cross-validated our coordinates against existing datasets in OpenStreetMap where available. When discrepancies occurred, we initiated a review process involving re-consultation with the relevant HSA. Finally, we conducted follow-up field visits to re-confirm coordinates.
Figure 5 provides a visual picture of residential areas in space. Data cleaning was performed using R Statistical Software version 4.3.125, including spelling corrections and duplicate removal.

Map displaying the spatial distribution of geolocated residential areas in Blantyre district. The inset in the map of Malawi shows where Blantyre district is geographically placed and boarders with other districts as well. Blantyre district is subdivided into city and rural areas. These are further divided into Traditional Authorities (TA’s) or Wards. The red dots represent geolocated residential areas. Some residential areas geolocated outside Blantyre district were done intentionally as these areas indicated to have a good number of people accessing services in health centers in Blantyre district and will be used for further analysis.
During data integration, we encountered multiple spelling variations and typographical errors in residential area names across different data sources. We addressed these inconsistencies through a standardization process that included manual verification with HSAs and local authorities to confirm matching locations. This approach enabled us to resolve spelling variations across 764 unique locations, ensuring data integrity while preserving local naming conventions.
Cost analysis
The total cost of the mapping process was 2,005.69 USD. Costs were calculated based on actual spending converted from Malawian Kwacha (MWK) to USD using median exchange rates from July 3–24, 2023, the actual spending period. Table 1 provides a detailed breakdown of costs, including categories such as lunch allowances (based on predefined rates set by MLW), transportation, and airtime for communication and data syncing.
To contextualize the cost-effectiveness of our mapping initiative, we compared our expenditure of $2,005.69 for mapping 764 residential areas in Blantyre district with similar mapping initiatives. Our approach demonstrates significant cost savings, particularly when contrasted with conventional mapping efforts in the region.
Informal discussions with surveying professionals indicate that conventional mapping exercises in Malawi utilizing professional surveyors may incur significantly higher costs, ranging from $15,000 to $30,000 for comparable coverage. This translates to $15–25 per mapped location, requiring 30–40 days for completion. These figures underscore the potential for cost reduction through localized and participatory mapping approaches.
Our project’s cost per mapped location stands at approximately $2.60, which is lower than the per-location costs observed in conventional mapping exercises in Malawi. This efficiency highlights the feasibility and scalability of community-engaged mapping strategies in resource-constrained settings.
Our participatory mapping approach reduced costs primarily through leveraging local knowledge (eliminating need for extensive training), utilizing existing HSA networks (reducing recruitment costs), and employing simplified technologies that did not require specialized equipment. While direct comparisons must account for differences in geography, infrastructure, and project scope, our approach demonstrates significant cost advantages over conventional mapping methodologies while maintaining acceptable spatial accuracy (<5 meters).
Timeliness
Time efficiency is a critical consideration for mapping initiatives supporting outbreak response. Our data collection was completed in 15 working days (July 3–24, 2023, excluding weekends), covering 764 locations across Blantyre district. This translates to approximately 51 locations mapped per day by our team of five data collectors. Put differently, each data collector recorded an average of 10 residential locations per day.
To contextualize this timeliness, conventional mapping approaches employing professional surveyors typically require 4–6 weeks for similar coverage. On the other hand, remote sensing approaches, while potentially faster for initial data acquisition, necessitate substantial post-processing time and ground verification. For instance, UNICEF’s application of GIS and remote sensing in Ethiopia and Madagascar highlighted the need for extensive post-processing and field validation, often resulting in a total time investment of 3–4 weeks36.
When incorporating timeliness into our cost-benefit analysis, our approach demonstrates significant advantages. Table 2 presents a comparative analysis of time, cost, and coverage metrics against conventional professional survey. Sustainability was assessed based on four key criteria. First, local capacity requirements – the extent to which the approach builds local expertise versus relying on external specialists. Second, ongoing resource needs – long-term costs for maintaining and updating the dataset. Third, community ownership – level of local stakeholder engagement and investment in the process, and fourth, scalability – ease of replication in similar setting. Our participatory approach achieved ‘Medium’ sustainability due to its reliance on existing HSA networks and community knowledge, while conventional surveys received ‘Low’ rating due to dependence on external expertise and higher ongoing costs.
This temporal advantage is particularly valuable in outbreak contexts where rapid intervention is essential for controlling disease spread. The WHO’s outbreak response guidelines emphasize the importance of timely data collection and mapping to inform intervention strategies effectively. While specific timeframes may vary depending on the nature of the outbreak, the median time to detection in the WHO African Region has been reported as 8 days, with a median time to end of 77 days37. Our methodology’s completion timeframe of 15 working days aligns with this recommendation, enhancing its suitability for emergency public health applications.


