
Image source: Getty Images
With the Middle East conflict sending oil prices soaring, the idea of a stock market crash is back on people’s minds. When you also see big‑name indicators flashing red, it is easy to wonder if a fall’s coming, already underway, or quietly cooling in the background.
One key measure analysts use to gauge market health, named after billionaire investor Warren Buffett, recently hit an all-time high, but has since begun retreating.
What could this mean for global markets?
What’s the Buffett Indicator?
The Buffett Indicator compares the value of the market against the economy, usually measured as market-cap divided by GDP. In simple terms, it asks: how expensive are shares overall compared to the real economy underneath them?
A reading above 100% means the market’s overvalued, ie: worth more than the economy produces in a year. Recently, the indicator’s eased from an all‑time high of 221.6% to around 216%. That’s still very high but looks like the beginning of a reversal.
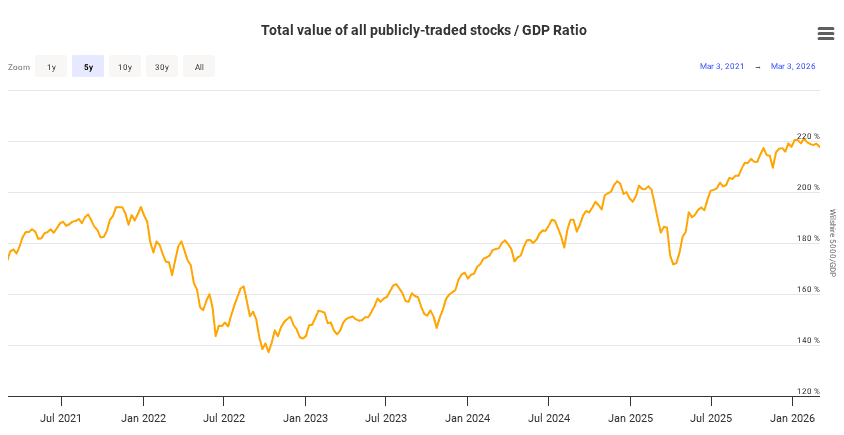
The still-high reading alone doesn’t signal a crash but it could be the early signs of a shift in trajectory.
How UK investors can prepare
Rather than trying to guess the exact timing of a crash, UK investors can focus on being ready for a range of outcomes. A few practical steps can help, such as accumulating cash, trimming risky positions and titling towards defensive shares.
One classic defensive pick is National Grid (LSE: NG.), which owns and operates electricity and gas networks in the UK and parts of the US. The utility giant earns regulated returns for running critical energy infrastructure, so its revenues are better protected against day‑to‑day volatility.
Not only is it more stable in turbulent times but it’s got excellent income credentials. It’s paid uninterrupted dividends for 31 years, with a policy to grow the dividend broadly in line with inflation. That’s the sort of characteristics income investors like to see.
The current payout ratio’s around 80% and cash generation’s strong, with cash flow covering the dividend roughly 3.6 times.
Valuation-wise, it’s a bit high, trading on a forward price-to-earnings (P/E) of about 17. But its FY2025 results were impressive, with underlying profit up about 12%, helped by strong performance across UK and US networks and strategic investments.
Not without risk
A heavy debt load means stubborn interest rates could squeeze National Grid’s profits over time. The recent oil and gas supply shock has also had an impact. Higher energy prices and volatility have increased scrutiny of utilities and pushed governments and regulators to think harder about affordability and security of supply.
On the other hand, it has strengthened the case for investment in infrastructure to support renewables, which is exactly where it spends heavily. That sort of long‑term, regulated investment programme can help smooth results through economic ups and downs.
Playing it safe
When things get shaky, defensive shares offer a way to reduce risk without exiting the market entirely. As a provider of essential infrastructure with regulated earnings and a long history of paying dividends, National Grid’s one worth considering.
Steady cash flows combined with inflation‑linked income make it a sensible candidate as part of a diversified portfolio. But it’s not the only defensive share I’ve been looking at lately…


