Study design
We performed a retrospective cohort analysis using the Medical Information Mart for Intensive Care IV (MIMIC- IV), a major database based in the United States15. Patient information from 2008 to 2019 who were admitted to the intensive care units (ICUs) at Beth Israel Deaconess Medical Center is included in the MIMIC- IV database, which is both comprehensive and of high quality. One of the authors, CJM, was able to successfully complete the necessary training to use the database and acquire the certificate (certification number 12473022). Because the project did not affect clinical care and all protected health information was anonymized, individual patient permission was waived.
Selection of participants
Patients in the MIMIC-IV who met the criteria for sepsis were considered candidates for participation in the study. The sepsis was determined to be present based on the Third International Consensus Definitions for Sepsis and Septic Shock (Sepsis-3) criteria2; Briefly, sepsis was diagnosed in individuals with proven or suspected infection and an acute change in overall Sequential Organ Failure Assessment (SOFA) score of ≥ 2 points. The MIMIC-IV recognized infection based on the International Classification of Diseases, 9th Edition (ICD-9) code. The study included data from the initial hospital/ICU admission (if a patient has been admitted many times). Patients with a body temperature > 38 °C were excluded due to the small sample size in this group, which could affect statistical power and data consistency. Additionally, the distinct pathophysiological mechanisms of hyperthermia in sepsis make it challenging to draw reliable conclusions, so excluding this subgroup ensures a more homogeneous analysis focused on normothermic and hypothermic cases. We excluded patients who spent less than 24 h in the ICU and whose body temperature was greater than 38 °C. Included patients for whose mean BT < 36 °C during the first 24 h after admission to the ICU were classified as the hypothermia group, and the rest of the patients comprised the no hypothermia group. Figure 1 depicts the patient enrollment process of this study.
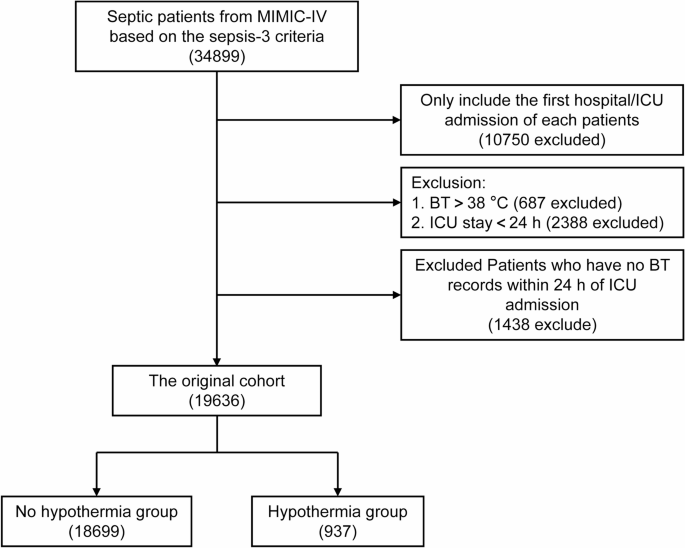
Screening of admissions for inclusion.
Variable extraction
Using Structured Query Language (SQL), baseline characteristics within the first 24 h after ICU admission were obtained, including age, gender, race, marital status, insurance, admission type and weight. Vital signs included the heart rate (HR), respiratory rate (RR), systolic blood pressure (SBP), diastolic blood pressure (DBP), mean BT and saturation of pulse oxygen (SpO2). Laboratory variables including blood glucose (Glu), haematocrit (HCT), haemoglobin (HGB), platelet (PLT) count, white blood cell (WBC) count, anion gap (AG), bicarbonate, calcium, chloride, sodium, potassium, blood urea nitrogen (BUN), creatinine (Cr), international normalized ratio (INR), prothrombin time (PT), partial thromboplastin time (PTT) and urine output were measured during the first 24 h in the ICU. Severity at admission as measured by SOFA score and the Simplified Acute Physiology Score II (SAPS II). Comorbidities including myocardial infarction (MI), congestive heart failure (CHF), cerebrovascular disease, chronic obstructive pulmonary disease (COPD), mild liver disease, diabetes without complication, diabetes with complication, renal disease, malignant cancer, severe liver disease and acquired immune deficiency syndrome (AIDS) were also collected for analysis based on the recorded ICD-9 codes in the MIMIC-IV database. The use of mechanical ventilation, application of continuous renal replacement therapy (CRRT) and extracorporeal membrane oxygenation (ECMO), and administration of vasoactive agent were also recorded.
Outcomes
The primary outcome in the present study was 180-day mortality. Secondary outcomes included 360-day mortality, ICU length of stay (LOS) and in-hospital mortality.
Statistical analysis
No data loss occurred for categorical variables. Less than 10% of continuous variables were lost, thus mean values were substituted for the missing information (Table S1). Using the Anderson-Darling test, the normal distribution of all continuous variables was examined (Table S2). Continuous variables are shown as medians [interquartile ranges (IQRs)]; categorical variables are presented as total numbers and percentages. Comparisons between groups were made using the χ2 test for categorical variables and the Mann-Whitney U test for continuous variables, as appropriate.
The total number of initial participants comprised the original cohort. PSM was used to create well-balanced groupings, notably the matched cohort, in addition to the original cohort. The propensity score was calculated utilizing a non-parsimonious multivariable logistic regression model, with hypothermia as the dependent variable and all baseline parameters (age, gender, race, marital status, insurance, admission type, weight, HR, RR, SBP, DBP, BT, SpO2, Glu, HCT, HGB, PLT count, WBC count, AG, bicarbonate, calcium, chloride, sodium, potassium, BUN, Cr, INR, PT, PTT, urine output, SOFA score, SAPS II, MI, CHF, cerebrovascular disease, COPD, mild liver disease, diabetes without complication, diabetes with complication, renal disease, malignant cancer, severe liver disease, AIDS, the use of mechanical ventilation, application of CRRT and ECMO, and administration of vasoactive agent)as the independent factors. Patients in the hypothermia group were matched with patients in the no hypothermia group using the greedy nearest neighbor matching method with a caliper width of 0.2. In addition, the predicted propensity ratings were used as weights to generate an IPTW cohort (called weighted cohort). PSM and IPTW-based propensity score adjustments were also applied to confirm the validity of our findings16,17,18. To assess the efficacy of the PSM and IPTW, the standardized mean differences (SMD) were computed. SMD < 0.1 is considered a reasonable compromise between the groups19.
All statistical analyses were performed using R software (version 4.1.1), and P < 0.05 was considered statistically significant.


