Study participant disposition and baseline characteristics
From 9 August 2023 to 5 December 2023, 73 participants were screened in part I. Recruitment was paused when the minimal enrollment target was met, and a total of 55 were randomized in a 1:1:1 ratio to cohorts 1–3, receiving PEG-IFNα 180 μg, elebsiran 200 mg plus PEG-IFNα 180 μg, and elebsiran 100 mg plus PEG-IFNα 180 μg, respectively. At 24 weeks post-EOT, 51 participants completed the study (Fig. 1a). The mean (and s.d.) age of cohorts 1–3 was 44.0 (8.4) years. Among all randomized participants, 85.5% were male, 98.2% were Asian and 78.2% had negative hepatitis B e-antigen (HBeAg) status at baseline. Baseline HBsAg levels ranged from 2.02 to 3.39 log10(IU ml−1), with a mean (s.d.) of 2.78 (0.37) log10(IU ml−1). Demographic and baseline characteristics were generally balanced across cohorts 1–3 (Table 1).
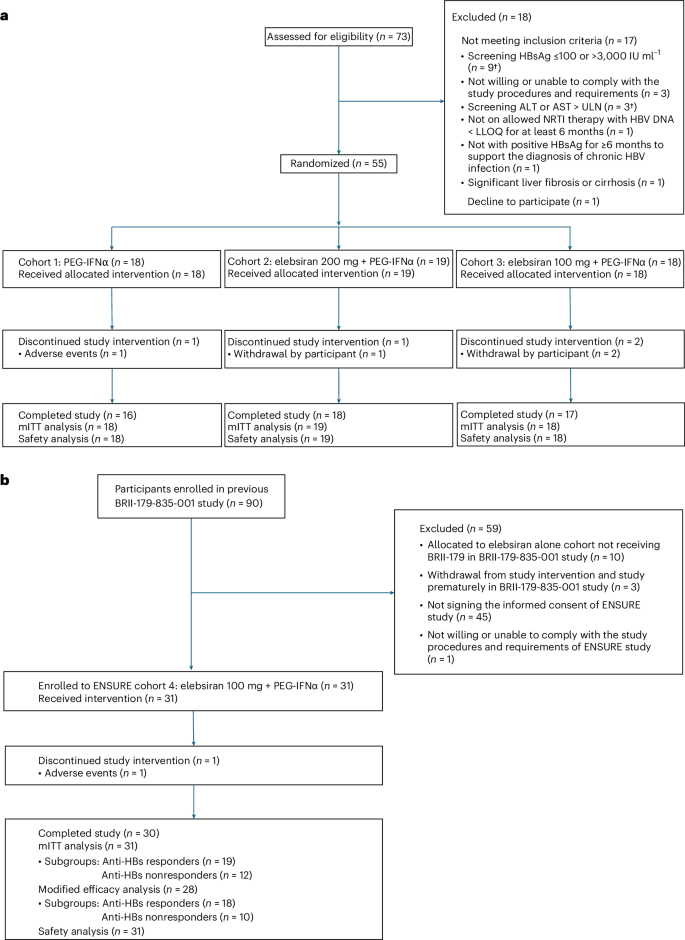
a, Cohorts 1–3. The dagger indicates that one participant with ALT or AST > ULN also had HBsAg >3,000 IU ml−1. b, Cohort 4. The mITT (modified intention-to-treat) analysis set is defined as all participants who received at least one dose of study intervention, with at least one post-baseline visit up to week 48. The modified efficacy analysis set is defined as all participants who had baseline HBsAg >100 IU ml−1 and received at least one dose of study intervention, with at least one post-baseline visit.
From 24 November 2023 to 29 February 2024, 31 participants who completed elebsiran 100 mg and BRII-179 treatment in the previous BRII-179-835-001 study15 were enrolled to part II (cohort 4), receiving elebsiran 100 mg plus PEG-IFNα 180 μg. The median time between completion of treatment in the BRII-179-835-001 study and enrollment into cohort 4 was 17.8 months, ranging from 13.8 to 23.7 months. One participant discontinued study interventions and withdrew prematurely (Fig. 1b). The baseline HBsAg level of all participants (n = 77) from the BRII-179-835-001 study who received nine doses of elebsiran plus BRII-179 is shown in Extended Data Fig. 2a, by categorization into BRII-179 anti-HBs responders or nonresponders based on peak anti-HBs titer (≥10 IU l−1 or −1). Among the 31 participants enrolled in this study, 19 participants were BRII-179 anti-HBs responders and 12 participants were nonresponders. Notably, approximately half of the BRII-179 anti-HBs responders (9 out of 19, 47.4%) and only one of the nonresponders had baseline HBsAg level >1,500 IU ml−1, ranging from 1,514 to 6,479 IU ml−1 in the BRII-179-835-001 study, indicating that BRII-179 may elicit anti-HBs responses in participants regardless of baseline HBsAg levels (Extended Data Fig. 2b). The mean (s.d.) age for cohort 4 was 50.3 (8.0) years. Among cohort 4 participants, 74.2% were male, 93.5% were Asian and 90.3% had negative HBeAg status at baseline. The mean (s.d.) baseline HBsAg was 2.45 (0.42) log10(IU ml−1) and was slightly higher in anti-HBs responders at 2.53 (0.45) log10(IU ml−1) compared with nonresponders at 2.31 (0.35) log10(IU ml−1); and three participants had baseline HBsAg ≤100 IU ml−1 (one anti-HBs responder and two nonresponders). Eight participants had anti-HBs ≥10 IU l−1 detected at the time of enrollment into cohort 4 (Table 1).
Primary efficacy outcome
Cohorts 1–3
At EOT, HBsAg loss was observed in 5 of 19 participants (26.3%) administered elebsiran 200 mg plus PEG-IFNα (cohort 2) and 6 of 18 participants (33.3%) administered elebsiran 100 mg plus PEG-IFNα (cohort 3), compared with 1 of 18 participants (5.6%) administered PEG-IFNα monotherapy (cohort 1) (Table 2). At 24 weeks post-EOT follow-up, HBsAg loss was observed in 4 of 19 participants (21.1%) in cohort 2 and 6 of 18 participants (33.3%) in cohort 3, compared with 1 of 18 participants (5.6%) in cohort 1 (Table 2). The Bayesian analysis results further supported the potential benefit of the combination therapy, demonstrating over an 85% probability of at least a 10% difference between either cohort 2 or cohort 3 and cohort 1 at EOT and at least a 5% difference between either cohort 2 or cohort 3 and cohort 1 at 24 weeks post-EOT (Table 2 and Extended Data Table 1).
HBsAg loss rate at either EOT or 24 weeks post-EOT was comparable between elebsiran 200 mg (cohort 2) and elebsiran 100 mg (cohort 3). Across the three cohorts, all participants achieving HBsAg loss at EOT or 24 weeks post-EOT had a baseline HBsAg level −1 (Supplementary Table 1).
Cohort 4 and cohort 4 subgroups
At EOT, HBsAg loss was observed in 13 of 31 participants (41.9%) in cohort 4. In the key subgroup analysis evaluating HBsAg loss rates in participants with demonstrated immunological response to previous immunization with BRII-179, HBsAg loss occurred in 11 of 19 BRII-179 anti-HBs responders (57.9%) compared with 2 of 12 nonresponders (16.7%) (Table 3). At 24 weeks post-EOT, HBsAg loss was observed in 9 of 31 participants (29.0%) in cohort 4, and by subgroup, HBsAg loss occurred in 8 of 19 BRII-179 anti-HBs responders (42.1%) compared with 1 of 12 nonresponders (8.3%) (Table 3). All participants who achieved sustained HBsAg loss at 24 weeks post-EOT in cohort 4 had a baseline HBsAg level −1 at the beginning of the ENSURE study (Supplementary Table 2). However, it is noteworthy that four out of eight participants (50.0%) in cohort 4 who were BRII-179 anti-HBs responders and achieved sustained HBsAg loss had baseline HBsAg levels exceeding 1,500 IU ml−1 (range 1,514–3,086 IU ml−1) when enrolled in the previous BRII-179-835-001 study. A modified efficacy analysis was also conducted for cohort 4, excluding the three participants with baseline HBsAg levels ≤100 IU ml−1. This analysis yielded a comparable result (Extended Data Table 2).
Across cohorts 1–4, all participants who achieved HBsAg loss at 24 weeks post-EOT met the predefined NRTI discontinuation criteria (Methods) and entered a 24-week NRTI discontinuation monitoring period, except for one participant from cohort 3, who was excluded due to HBeAg positivity.
Key secondary efficacy outcomes
Serum HBsAg and change from baseline over time
Cohorts 1–3
Throughout both the treatment and follow-up periods, a higher proportion of participants receiving elebsiran plus PEG-IFNα (cohorts 2 and 3) achieved greater reductions in HBsAg levels and higher rates of HBsAg loss compared with those receiving PEG-IFNα monotherapy (cohort 1). Among the 18 participants in cohort 1, 7 and 5 participants (38.9% and 27.8%) achieved HBsAg −1 and −1, respectively, at week 48, and 6 and 2 participants (33.3% and 11.1%) maintained these levels at week 72. By contrast, most participants in cohorts 2 and 3 achieved HBsAg −1 and −1 at week 48: 17 of 19 (89.5%) and 12 of 19 (63.2%), respectively, in cohort 2, and 14 of 18 (77.8%) and 14 of 18 (77.8%), respectively in cohort 3. At week 72, HBsAg levels of −1 and −1 were observed in 12 of 19 (63.2%) and 5 of 19 (26.3%), respectively, in cohort 2, and 13 of 18 (72.2%) and 8 of 18 (44.4%), respectively, in cohort 3 (Fig. 2a).
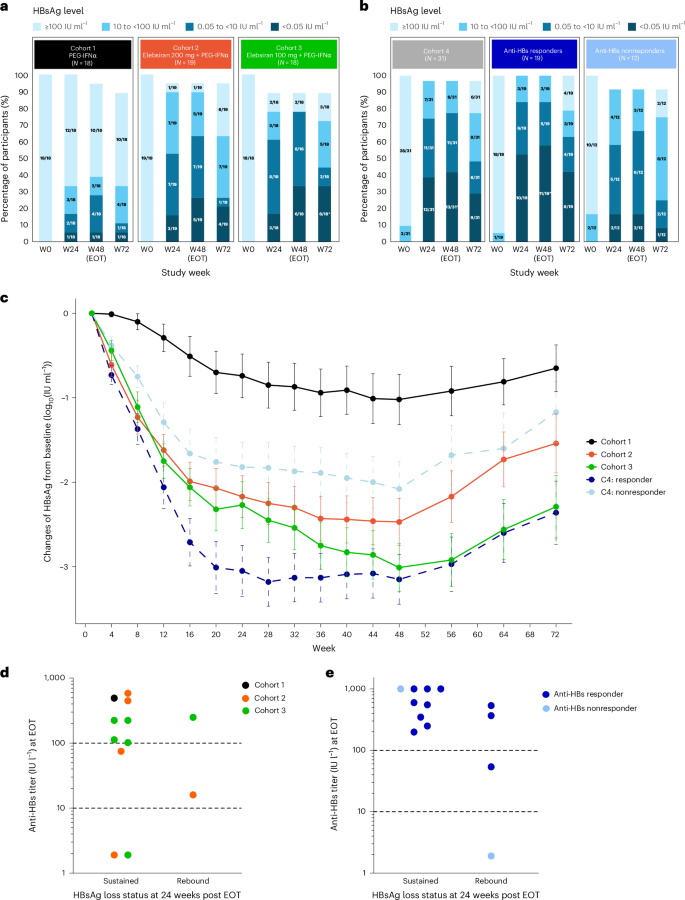
a, HBsAg level in participant by study visit in cohorts 1–3. The asterisk indicates that, in cohort 3, one participant who achieved HBsAg loss at week 48 (EOT) experienced HBsAg rebound after EOT, while another participant achieved HBsAg loss at week 56 (8 weeks post-EOT), which was sustained through week 72. b, HBsAg level in participant by study visit in cohort 4. The asterisk indicates that, in cohort 4 (BRII-179 anti-HBs responder group), one participant had HBsAg levels −1 at week 24 but experienced a rebound before week 48, while two additional participants achieved HBsAg loss between week 24 and week 48. c, Mean (s.e.m.) HBsAg change from baseline through week 72 from the mITT set. The error bars represent s.e.m. Cohort 1, N = 18; cohort 2, N = 19; cohort 3, N = 18; cohort 4 (C4) responder, N = 19; C4 nonresponder, N = 12. d, The relationship between anti-HBs titer at the EOT and sustained HBsAg loss at 24 weeks post-EOT in cohorts 1–3. The dashed line represents anti-HBs levels of 10 and 100 IU l−1. e, The relationship between anti-HBs titer at the EOT and sustained HBsAg loss at 24 weeks post-EOT in cohort 4 subgroups. The dashed line represents anti-HBs levels of 10 and 100 IU l−1. Anti-HBs responder was defined as peak anti-HBs titer >10 IU l−1 by week 44 after nine doses of BRII-179 in the BRII-179-835-001 study.
The mean change from baseline in serum HBsAg level through week 72 was substantially greater (P 3) in cohorts 2 and 3 compared with cohort 1 (Fig. 2c), indicating enhanced HBsAg decline with elebsiran and PEG-IFNα.
Cohort 4 and cohort 4 subgroups
By week 48, 13 of 31 participants (41.9%) achieved HBsAg loss at the EOT, with 11 of these (84.6%) reaching this endpoint within the first 24 weeks of the 48-week treatment period (Fig. 2b). BRII-179 anti-HBs responders achieved higher reductions in HBsAg levels and rates of HBsAg loss compared with nonresponders. At week 48, 24 of 31 participants (77.4%) reached HBsAg levels below 10 IU ml−1. At week 72, approximately half of participants (15 out of 31, 48.4%) maintained at this level (Fig. 2b). Subgroup analysis revealed that 12 of 19 participants (63.2%) of BRII-179 anti-HBs responders maintained HBsAg levels −1 at week 72, compared with only 3 of 12 participants (25.0%) in the nonresponders (Fig. 2b).
Interestingly, BRII-179 anti-HBs responders appeared to experience greater and more rapid HBsAg loss and reductions compared with both BRII-179 anti-HBs nonresponders and those in cohorts 2 and 3 naive to BRII-179 (Fig. 2a–c and Extended Data Fig. 3), suggesting that the immunological modification or priming may impact not only the magnitude but also the timing of HBsAg loss.
Relationship between HBsAg seroconversion at EOT and sustained HBsAg loss at 24 weeks post-EOT
During the 24-week follow-up period after treatment, HBsAg rebound was observed across all cohorts in which participants received elebsiran and PEG-IFNα (Fig. 2d,e).
Across cohorts 1–3, 12 participants achieved HBsAg loss at EOT. Among them, ten (83.3%) also achieved HBsAg seroconversion, defined as HBsAg loss and anti-HBs titer ≥10 IU l−1, and eight (66.7%) had anti-HBs titer ≥100 IU l−1 at EOT. Among these eight participants with anti-HBs titer ≥100 IU l−1 at EOT, seven (87.5%) maintained HBsAg loss at 24 weeks post-EOT. Among the two participants with anti-HBs titer between 10 IU l−1 and 100 IU l−1 at EOT (75 and 16 IU l−1, respectively), only the participant with the higher titer sustained HBsAg loss. Notably, the two participants who did not achieve HBsAg seroconversion also sustained HBsAg loss at 24 weeks post-EOT (Fig. 2d).
In cohort 4, among the 13 participants who achieved HBsAg loss at EOT, 12 (92.3%) had HBsAg seroconversion. Eleven of the 12 participants with HBsAg seroconversion had anti-HBs titer ≥100 IU l−1, including 10 participants in the anti-HBs responder group and 1 from the nonresponder group. Among the 11 participants with HBsAg loss and anti-HBs titer ≥100 IU l−1 at EOT, 9 (81.8%) sustained HBsAg loss at 24 weeks post-EOT and 2 (18.2%) experienced HBsAg rebound. The other two participants who rebounded by week 72 had either no detectable anti-HBs response or anti-HBs titer −1 at EOT (Fig. 2e). HBsAg rebound was observed in both BRII-179 anti-HBs responders and nonresponders.
Safety and tolerability
Adverse events
Most (78 of 86, 90.7%) participants experienced at least one treatment-emergent adverse event (TEAE). The incidence of TEAEs, either overall or by National Cancer Institute Common Terminology Criteria for Adverse Events grade, was generally comparable in participants receiving PEG-IFNα (cohort 1) and elebsiran plus PEG-IFNα (cohorts 2, 3 and 4) (Table 4). Most of the TEAEs were of grade 1 or 2 in severity. Grade ≥3 TEAEs were reported in 6 of 18 participants (33.3%) in cohort 1, compared with 6 of 19 participants (31.6%) in cohort 2, 6 of 18 participants (33.3%) in cohort 3 and 5 of 31 participants (16.1%) in cohort 4 (Table 4). The most common TEAEs are summarized in Extended Data Table 4. Most TEAEs were consistent with established adverse reactions of PEG-IFNα.
In the 68 participants who received elebsiran plus PEG-IFNα in cohorts 2–4, the incidence of elebsiran-related TEAEs per cohort ranged from 32.3% (10 of 31) to 72.2% (13 of 18), while the incidence of PEG-IFNα-related TEAEs per cohort ranged from 61.3% (19 of 31) to 100% (18 of 18); the incidence of treatment-related adverse events attributed to both study interventions per cohort ranged from 22.6% (7 of 31) to 55.6% (10 of 18) (Table 4). The most common (incidence ≥10%) elebsiran-related TEAEs, including decrease in neutrophil count and platelet count and increase in liver function tests, were consistent with the most common PEG-IFNα-related TEAEs. Across cohorts 2–4, four (21.1%), five (27.8%) and four (12.9%) participants reported at least one elebsiran-related injection site reaction, respectively, all of which were grade 1 or 2 in severity. The most common elebsiran-related injection site reaction was injection site erythema.
Four serious adverse events (SAEs) were reported in 4 of 86 participants (4.7%): one seizure and one nodal marginal zone B cell lymphoma in cohort 1, one syncope in cohort 2 and one appendicitis in cohort 4. None of the four SAEs was considered related to elebsiran by the investigators; the SAEs of seizure and syncope were attributed to PEG-IFNα, while the other two were deemed unrelated to either elebsiran or PEG-IFNα (Table 4). All SAEs were resolved except for the participant diagnosed with lymphoma who withdrew from the study prematurely.
Laboratory abnormalities
Overall, the incidence of alanine aminotransferase (ALT) elevations was comparable between participants administered PEG-IFNα (cohort 1: 15 of 18, 83.3%) and elebsiran plus PEG-IFNα (cohort 2: 15 of 19, 78.9%; cohort 3: 16 of 18, 88.9%; cohort 4: 27 of 31, 87.1%). Most of the ALT increases were grade 1 or 2 in severity. ALT increases of grade 3 were observed in 2 of 19 (10.5%) of cohort 2 and 5.6% (1 of 18) of cohort 3 participants (Extended Data Table 5). These three participants did not have evidence of liver decompensation, and their ALT levels returned to normal by week 72. No participants had ALT or aspartate aminotransferase (AST) >10× upper limit of normal (ULN), total bilirubin >2× ULN or alkaline phosphatase >1.5× ULN.
Across the cohorts, 78 of 86 participants (90.7%) had neutrophil count decreases; the incidence was similar comparing cohort 1 versus cohort 2, 3 or 4. Neutrophil count decreases of grade ≥3 were observed in 7 of 18 participants (38.9%) in cohort 1, 7 of 19 participants (36.8%) in cohort 2, 4 of 18 participants (22.2%) in cohort 3 and 10 of 31 participants (32.3%) in cohort 4 (Extended Data Table 5). Platelet decreases were observed in 53 of 86 participants (61.6%), with a similar incidence across all cohorts. Platelet decreases of grade ≥3 occurred in 1 of 19 participants (5.3%) in cohort 2 and 1 of 18 participants (5.6%) in cohort 3 (Extended Data Table 5). No bleeding episodes were reported.
Alpha fetoprotein (AFP) elevation (>20 μg l−1) was observed at the EOT in 4 of 19 participants (21.1%) in cohort 2, 6 of 18 participants (33.3%) in cohort 3 and 6 of 31 participants (19.4%) in cohort 4, compared with 0 of 18 participants (0%) in cohort 1. AFP declined to −1 in all these participants after the EOT (Extended Data Table 6). Serial ultrasound was prospectively conducted; no evidence of malignancy was identified.


