Demographics of the study population
A total of 325 subjects including 150 active TB patients, 50 non-TB other pulmonary diseases cases and 125 healthy individuals were enrolled in the study. Demographic characteristics of the study participants are presented in Table 1. Briefly, the majority of study participants were 18–30 years of age (47.4%), male (55.1%), lived in Karachi district east (44.0%) and were employed (54.2%). A BCG scar was present in 86.2% of the study participants. The median age of active TB patients, non-TB other pulmonary diseases cases and healthy individuals were 34.5 (IQR 23–50), 27 (IQR 24–37) and 44 (IQR 30–51) years, respectively. Significant differences in age, BMI and the proportion of BCG vaccinated participants were observed between TB patients and other groups (p
Clinical characteristics
The most common presenting symptoms in active TB patients were cough (92.0%), fever (73.3%), weight loss (72.0%) and shortness of breath (64.7%). Non-TB other pulmonary diseases patients presented with shortness of breath (100.0%), cough (90.0%) and body pain (58.0%). The most prevalent underlying co-morbidity in active TB patients was diabetes, followed by hyper and hypotension (Table 2). Chronic obstructive pulmonary disease (COPD) was the most prevalent respiratory condition among non-TB other pulmonary diseases cases. Of the 50 patients in the non-TB group, 12 had COPD and 8 had pleural effusion.
Immunological findings
Mtb infection was detected using three immunoassays, namely the Tuberculin skin test (TST) and two IGRA assays (X-DOT-TB and QFT-Plus). These methods were compared with each other to evaluate their diagnostic performance and the concordance among the three tests.
Tuberculin skin test (TST) results
TST was performed on 325 participants from three study groups (ATB = 150, Non-TB other pulmonary diseases = 50 and Healthy individuals = 125). Three subjects were lost at follow-up. TST results were positive (> 5 mm induration) in 52 (35.3%) active TB patients, 16 (32.0%) non-TB other pulmonary diseases cases and 15 (12.0%) healthy individuals (Table 3).
X-DOT-TB assay results
X-DOT-TB which is an ELISPOT based IGRA kit used for detection of Mtb infection, was performed in total 325 subjects (ATB = 150, NTBOPD patients = 50, Healthy individuals = 125). X-DOT-TB results were positive in 112 (74.7%) active TB patients, 10 (20.0%) non-TB other pulmonary diseases cases and 16 (12.8%) healthy individuals (Table 4).
QFT-Plus assay results
QFT-Plus which is an ELISA based IGRA kit used for detection of Mtb infection, was performed in 128 subjects (ATB = 55, NTBOPD patients = 20, Healthy individuals = 53). QFT-Plus results were positive in 29 (52.7%) active TB patients, 4 (20.0%) non-TB other pulmonary diseases cases and 12 (22.6%) healthy individuals (Table 5).
Comparison of sensitivity and specificity of IGRAs (X-DOT-TB and QFT-Plus) and TST
Of the 139 active TB patients (with 11 missing culture results), 137 (98%) were found culture positive for M. tuberculosis. All non-TB other pulmonary diseases patients were culture negative and all healthy individuals had normal Chest X-Rays.
The sensitivity and specificity of all three immunological assays were evaluated. Diagnostic sensitivity was calculated from active TB group using Mtb culturing as gold standard. Among the 137 Mtb culture positive cases, 109 were detected positively by both Mtb culturing and X-DOT-TB assay, and 49 were positive by both Mtb culturing and TST. In addition, among 52 cases tested, 29 were found positive in both Mtb culturing and QFT-Plus assay.
The sensitivity of the three assays, based on culture-confirmed cases, was 79.5% (109/137; 95% CI: 77.4–81.5) for X-DOT-TB, 55.7% (29/52; 95% CI: 52.9–58.5) for QFT-Plus, and 35.8% (49/137; 95% CI: 34.4–37.1) for the TST.
Of the 175 controls (including 125 healthy individuals and 50 non-TB other pulmonary diseases patients), 149 and 144 were detected positively by X-DOT-TB and TST, respectively. Of the 73 controls (including 53 healthy individuals and 20 non-TB other pulmonary diseases patients), 57 were detected positively by QFT-Plus.
The overall diagnostic specificity for X-DOT-TB, QFT-Plus and TST was 85.1% (149/175; 95% CI 83.2–87.0), 78.1 (57/73; 75.3–80.9) and 82.2% (144/175; 95% CI 80.3-84.08) respectively.
The diagnostic sensitivity of both IGRA assays i.e. X-DOT-TB and QFT-Plus was found to be significantly higher than TST (p p = 0.029 respectively, McNemar chi-square test), furthermore QFT-Plus had a significantly lower sensitivity than X-DOT-TB (p = 0.027). No significant differences were found between the specificities of X-DOT-TB and TST (p = 0.487), QFT-Plus and TST (p = 0.607) and X-DOT-TB and QFT-Plus (p = 0.549) (Fig. 2).
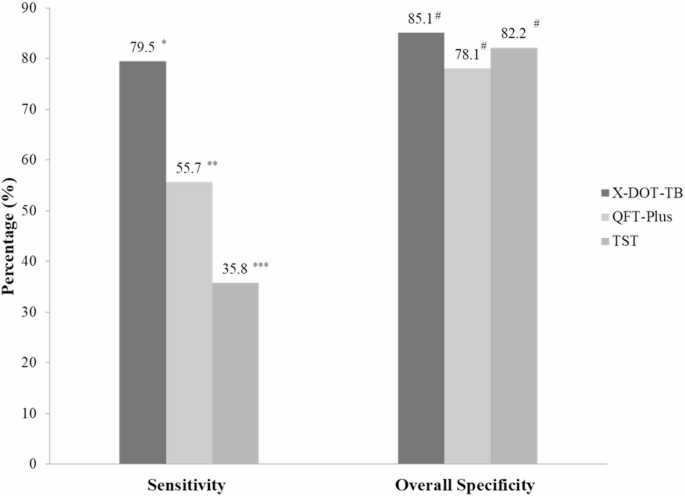
Comparison of sensitivity and overall specificity of X-DOT-TB, QFT-Plus and TST. *Significant difference between sensitivity of X-DOT-TB and TST, p- value ** Significant difference between sensitivity of QFT-Plus and TST, p- value = 0.029. *** Significant difference between sensitivity of QFT-Plus and X-DOT-TB, p-value = 0.027. # No significant difference was found between specificity of the assays (p > 0.05). TST: Tuberculin skin test.
A comparative evaluation of the sensitivity and specificity of all the three assays is presented in Table 6.
Diagnostic performance of IGRAs (X-DOT-TB and QFT-Plus) and TST
The diagnostic performance of all three assays (X-DOT-TB, QFT-Plus, and TST) was evaluated. The positive predictive value (PPV) of X-DOT-TB was found to be 81.1% and indicates that the probability of positively detecting Mtb infected patients was 81.1% for the assay. The negative predictive value (NPV) was found to be 79.6%, indicating that there was a 79.6% probability that individuals with a negative test result were disease-free. The positive likelihood ratio of X-DOT-TB when performed on Mtb-positive patients to have a positive result was 6.4 and the negative likelihood ratio of a disease positive individual to test negative was 0.24. The Diagnostic Accuracy of X-DOT-TB was 79.1% and the Diagnostic odds ratio was 26.6.
The PPV, NPV, LR+ and diagnostic accuracy of the QFT-Plus assay were found to be 64.5%, 70.3%, 2.2 and 56.6% respectively, and the PPV, NPV, LR+ and diagnostic accuracy of TST were found to be 60.4%, 60.2%, 1.94 and 36.6% respectively.
When compared with each other, X-DOT-TB showed the highest diagnostic performance, followed by QFT-Plus and TST. QFT-plus gave better diagnostic performance than TST. A comparative evaluation of the diagnostic performance of the three assays is presented in Table 7.
Concordance between IGRAs (X-DOT-TB and QFT-Plus) and TST
For further comparison of X-DOT-TB, QFT-Plus and TST the concordance between these assays was measured by kappa (k) coefficient. Good agreement (k = 0.46) was resulted between QFT-Plus and X-DOT-TB, while poor agreement (k = 0.314) and (k = 0.23) was found between X-DOT-TB and TST and QFT-Plus and TST, respectively. The concordance of all three immunological assays is presented in Table 8.
Factors associated with positive X-DOT-TB assay results
The association between baseline characteristics of study participants and positive X-DOT-TB assay results was evaluated using binary logistic regression analysis (Table 9). Multivariate logistic regression showed that subjects > 50 years of age (aOR = 1.9, 95% CI 1.0-3.9, p = 0.046), those who were underweight (aOR = 3.9, 95% CI 1.4–10.8, p = 0.007) and individuals with known exposure to TB contacts (aOR = 1.8, 95% CI 1.0-3.3, p = 0.041) were significantly more likely to test positive for Mtb infection. In contrast, subjects of urdu-speaking ethnic background had a significantly lower risk of testing positive compared to other ethnic groups (aOR = 0.44, 95% CI 0.24–0.81, p = 0.008).


